You open Google Search Console.
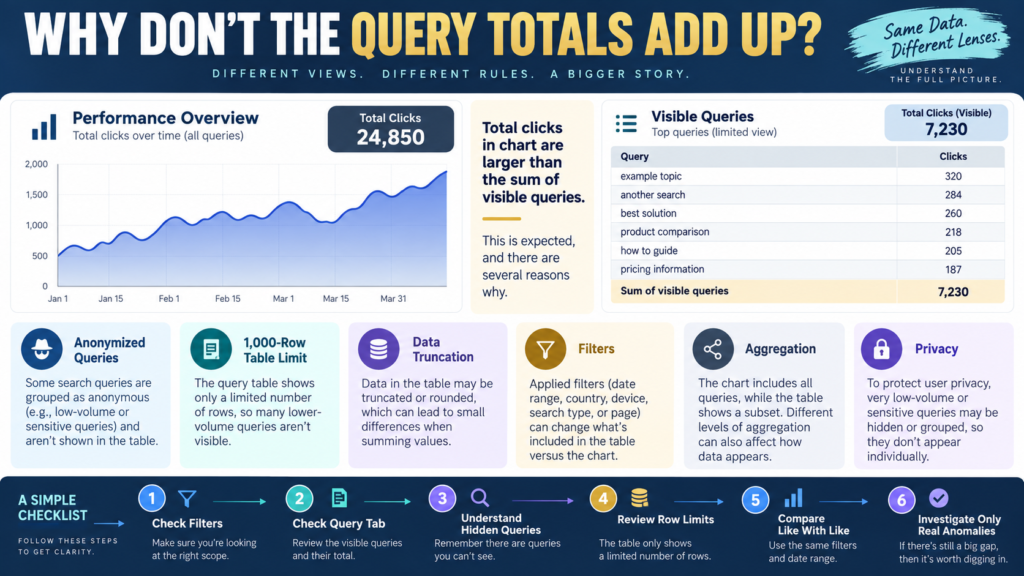
The Performance chart reports:
1,000 clicks
You switch to the Queries table.
You add the visible rows.
They total:
860 clicks
Now there appears to be a problem.
Where did the other 140 clicks go?
The first instinct may be:
- Search Console lost data.
- Tracking is broken.
- The report is inaccurate.
- Some keywords disappeared.
But Google specifically documents several reasons the chart and table totals can differ.
Among the most important are:
- Anonymized queries.
- Table-row limits.
- Data truncation.
- Filtering.
- Aggregation differences.
That means:
The query table is not always a complete line-by-line reconstruction of the chart total.
What Is an Anonymized Query?
Google omits some query details to protect user privacy.
These are often called anonymized queries.
They can include rare searches or searches that could expose personal or sensitive information.
Google states that anonymized queries can still be included in chart totals even though the individual query rows are not displayed.
That creates an expected gap.
Example
Performance chart:
1,000 clicks
Visible query rows:
920 clicks
Anonymized query clicks:
Not individually shown.
The missing 80 clicks do not automatically indicate a tracking failure.
They may be part of the privacy-protected data included in the overall total.
The Table Has a Row Limit
Google’s current documentation notes that the Search Console report table can display a maximum of 1,000 rows.
For a small site, that may not matter much.
For a larger site ranking for thousands of long-tail queries, it matters considerably.
The chart can reflect activity beyond the visible rows.
Data Truncation Matters Too
Google says Search Console stores and displays the most important rows rather than every possible query row in the standard interface.
Therefore:
Queries table ≠ guaranteed complete query database
The report is designed for useful performance analysis.
It is not a complete dump of every search phrase associated with the site.
Why Query Filters Change the Situation
This becomes especially important when adding a query filter.
For example:
Query contains: GA4
Google notes that anonymized queries are generally included in chart totals unless a query filter is applied.
Why?
Because Search Console cannot meaningfully determine whether a hidden query matches the visible query filter without compromising the privacy behavior behind anonymization.
As a result, filtered totals may behave differently.
“Contains” + “Does Not Contain” May Not Equal the Original Total
Suppose the unfiltered report shows:
10,000 clicks
You filter:
Queries containing “email”
and get:
3,000 clicks
Then:
Queries not containing “email”
and get:
6,500 clicks
Total:
9,500
Where are the remaining 500?
Google’s documentation explains that query filtering, anonymized queries, and data truncation can prevent the two filtered views from adding perfectly back to the unfiltered total.
Do not assume the filter is broken.
Page Filters Can Also Change Aggregation
Search Console can aggregate information differently depending on whether performance is being evaluated by property or page.
Google’s Performance documentation explains that aggregation choices can affect how clicks and impressions are counted.
This is another reason totals from different report configurations should not always be expected to match exactly.
Use Consistent Filters Before Comparing Numbers
Before diagnosing a discrepancy, check:
- Search type.
- Date range.
- Query filter.
- Page filter.
- Country.
- Device.
- Search appearance.
If one report has:
Web + United States + Mobile
and another has:
Web + All Countries + All Devices
their totals should be different.
Check the Date Range
A surprisingly common source of confusion is simply comparing different dates.
Search Console’s normal Performance reporting also uses its own date/time handling, and current documentation notes that most daily Performance data outside the 24-hour view is labeled using Pacific Time.
That can contribute to differences when comparing with another analytics platform using a different timezone.
Search Console and GA4 Should Not Match Exactly Either
Search Console measures Google Search performance.
GA4 measures activity after website tracking occurs.
Those are fundamentally different measurement systems.
My guide to why Search Console and GA4 traffic numbers don’t match explains why clicks, sessions, and users should not be treated as interchangeable.
Page-Level Query Analysis Still Works
The fact that the query table has limitations does not make it useless.
If you want to understand which visible queries are associated with one page, use a page filter first.
My page-level Search Console query guide explains that workflow.
You can still identify:
- Strong queries.
- Growing queries.
- Relevant impressions.
- CTR opportunities.
- Search intent.
Just remember that visible queries may not represent every query.
Regex Filters Still Have Value
Regex can help group related visible searches.
For example:
how|what|why
could help explore question-style queries when configured correctly.
The Search Console regex guide explains how to use regex for practical content research.
Again, query filtering can affect totals.
Use regex to answer a specific question—not reconstruct the complete unfiltered query database.
What If You Need More Rows?
Google provides other export options.
The Search Console API can provide more data than the 1,000-row interface limit, subject to its own quotas and limits. Google’s current documentation says Performance-report API data can support up to 50,000 rows per day per search type per property.
For very large sites, Search Console also provides bulk data export to BigQuery.
These tools are generally unnecessary for a small website that only needs practical SEO decisions.
Do not create a data-engineering project merely because 37 long-tail queries are hidden.
Do Not Estimate the Missing Query Names
Suppose:
Chart:
1,000 clicks.
Visible rows:
900 clicks.
Do not ask AI to invent the “missing 100 clicks.”
You know that a difference exists.
You do not know which hidden query strings produced it.
Privacy-protected query data should remain unknown.
Focus on the Queries You Can Act On
Visible queries can still reveal:
- Pages gaining impressions.
- Questions people ask.
- Search intent.
- CTR opportunities.
- Branded demand.
- Non-branded discovery.
- Content gaps.
You do not need 100% query visibility to make useful decisions.
When a Difference Deserves Investigation
Investigate further if:
- A familiar report suddenly changes dramatically.
- The discrepancy appears immediately after changing filters.
- A page-level view behaves unexpectedly.
- Current data differs sharply from historical behavior.
- Google reports a known data anomaly.
Google maintains a Search Console data-anomalies page for known reporting issues. Current documentation can distinguish logging problems from actual ranking or traffic changes.
When a Difference Is Probably Normal
A modest gap between:
Chart Total
and:
Visible Query Rows
is not automatically a problem.
Possible explanations already built into the system include:
- Privacy-protected anonymized queries.
- 1,000-row table limits.
- Truncated rows.
- Filtering behavior.
- Aggregation.
Understand those first.
A Simple Query Discrepancy Checklist
When totals do not match:
1. Confirm date range
Are both views identical?
2. Confirm Search type
Web, Image, Video, or News?
3. Remove filters temporarily
Does the discrepancy change?
4. Check whether you are summing visible query rows
Remember they may not include everything.
5. Consider anonymized queries
Hidden rows may remain part of chart totals.
6. Consider table limits
Large datasets may exceed visible rows.
7. Investigate only after eliminating normal reporting behavior
This prevents unnecessary SEO changes.
Conclusion
Search Console query totals do not always add up because the chart and visible query table are not guaranteed to contain exactly the same visible detail.
Important reasons include:
- Anonymized queries.
- Privacy protection.
- Table-row limits.
- Data truncation.
- Query filtering.
- Aggregation differences.
The difference does not automatically mean your Search Console property is broken.
Use the query table to understand visible search behavior.
Use chart totals for the broader performance picture.
And avoid assuming that every hidden click must have a visible query row.
Your Next Action
Open:
Search Console → Performance → Search Results
Choose:
Last 28 Days
Record:
Total Clicks From Chart: _____
Then open:
Queries
and note whether the visible rows appear to account for the entire total.
If they do not, complete this check:
Date Range Same? Yes / No
Search Type Same? Yes / No
Query Filter Active? Yes / No
Page Filter Active? Yes / No
Large Number of Query Rows? Yes / No
If the settings are consistent and the only issue is that the query rows do not fully reproduce the chart total, do not change your SEO strategy.
Instead, select one important page and analyze the visible queries associated with that page.
Use the data you can actually see to make one content or CTR decision, rather than trying to reconstruct privacy-protected queries you were never meant to see.