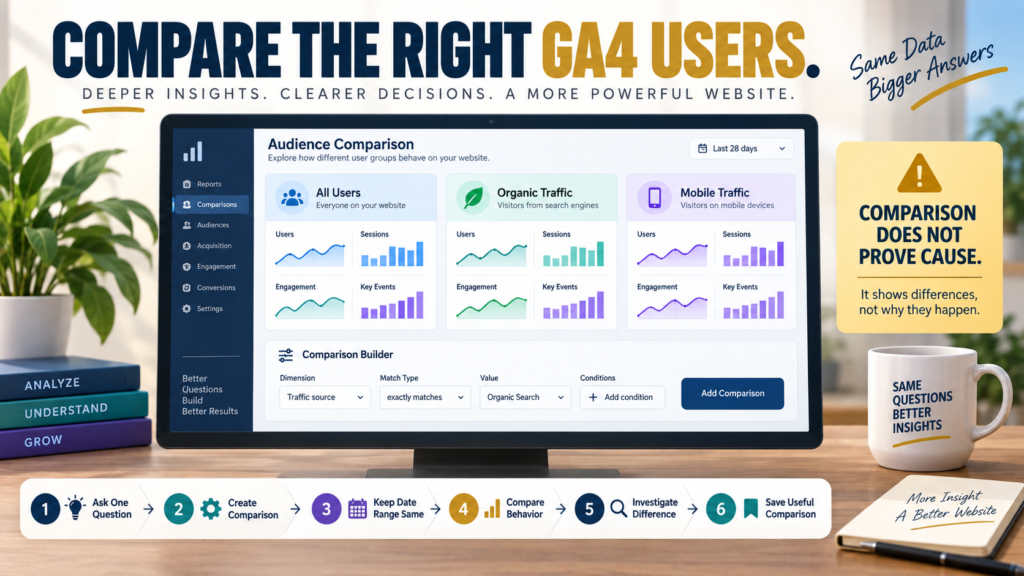
Google Analytics 4 comparisons let you evaluate different subsets of your data side by side.
For example, you might compare:
- Organic traffic with Direct traffic.
- Mobile users with desktop users.
- United States visitors with visitors from another country.
- One defined audience with another.
- Web traffic with app traffic.
Google’s current GA4 comparisons documentation explains that comparisons are built from dimensions and dimension values and can be applied across compatible reports.
This makes comparisons extremely useful.
It also creates an easy mistake:
Group A is different from Group B, therefore we know why.
GA4 usually tells you that two groups behaved differently.
It does not automatically prove what caused the difference.
Start With One Question
Do not begin by creating ten comparisons.
Begin with a question.
Examples:
Do mobile visitors engage differently from desktop visitors?
Does organic traffic generate more key events than Direct traffic?
Do returning visitors behave differently from new visitors?
One question creates a focused comparison.
How GA4 Comparisons Work
Google currently allows comparisons to use conditions based on dimensions and dimension values.
Examples of dimensions include:
- Platform.
- Country.
- Audience.
- Traffic-related dimensions where supported.
- Device-related dimensions where supported.
Multiple values within the same condition can use OR logic.
For example:
Country = United States OR Canada
Multiple separate conditions use AND logic.
For example:
Country = United States AND Platform = Web
That allows increasingly specific comparisons.
Do Not Make the Segment Too Small
Every added condition reduces the amount of data.
Suppose you create:
Mobile + United States + Organic Search + Returning User + One Landing Page
You may end with such a small group that the result becomes unstable.
Start broad.
Narrow only when the question requires it.
Example: Mobile vs Desktop
Suppose mobile users show:
- More users.
- Shorter sessions.
- Lower key-event rate.
It is tempting to conclude:
The mobile website is bad.
That is only one possible explanation.
Others include:
- Mobile visitors have different intent.
- Mobile traffic comes from different channels.
- Different landing pages attract mobile users.
- Desktop users are more likely to complete a complex task.
The comparison identifies where to investigate.
It does not finish the investigation.
Keep the Date Range Identical
This sounds obvious, but it matters.
If you compare:
Mobile — Last 28 Days
with:
Desktop — Previous 28 Days
you have mixed two variables:
- Device.
- Time.
Keep the date range identical when comparing groups.
Then you know the visible difference is at least being observed during the same period.
Compare the Same Metrics
Use consistent measures such as:
- Users.
- Sessions.
- Engagement.
- Views.
- Events.
- Key events.
- Revenue where appropriate.
Do not compare:
Mobile users
against:
Desktop sessions
and draw a direct conclusion.
Match the metric to the question.
Comparisons Stay Visible Across Report Analysis
When a comparison is applied, GA4 shows color-coded data for the selected groups.
This lets you move beyond a single total.
Instead of:
2,000 users
you can ask:
How did these particular groups contribute to the 2,000 users?
That segmentation can reveal patterns hidden by the overall average.
Use Comparisons With Acquisition
Suppose Organic Search and Direct traffic produce similar user counts.
Create comparisons for the two groups.
Then inspect:
- Engagement.
- Landing pages.
- Events.
- Key events.
Organic visitors might arrive primarily for educational content.
Direct visitors might already know the brand.
The groups may therefore behave differently for legitimate reasons.
Your GA4 User Acquisition vs Traffic Acquisition guide can help you choose the correct acquisition perspective before interpreting the comparison.
Use Comparisons With Engagement
Comparisons become especially useful when combined with engagement reporting.
For example:
All Users
vs:
Organic Traffic
vs:
Returning Visitors
You can examine whether one group produces more engaged sessions or time.
The GA4 Engagement Overview guide provides an important caution:
Engagement is useful.
It is not automatically a conversion.
Use Comparisons With Audiences
Google currently supports Audience as a comparison dimension when compatible.
That means a business could compare:
Customers
with:
All Users
or:
Returning Visitors
with another defined audience.
Your GA4 Audiences report guide explains why the audience definition matters before you judge the numbers.
If you define the audience poorly, the comparison will faithfully compare the wrong groups.
Current Saved Comparisons
Google has also introduced saved comparisons.
According to its current documentation, saved comparisons allow users with access to a property to reuse frequently needed comparison definitions instead of rebuilding them repeatedly.
Google currently notes that this feature is undergoing gradual rollout and may not yet be available in every property.
Where available, an Editor or higher can manage saved comparisons under:
Admin → Data display → Comparisons
Google currently allows up to 200 saved comparisons per GA4 property.
Do not create 200 merely because you can.
Save only comparisons you repeatedly use.
Useful Saved Comparisons
A small website might keep:
Organic Traffic
Useful for SEO analysis.
Mobile Traffic
Useful for device differences.
Returning Visitors
Useful for repeat-audience behavior.
Customers
Useful when customer activity is meaningfully tracked.
That is usually enough to start.
Prebuilt Comparisons
Google’s current documentation says GA4 can include prebuilt saved comparisons for commonly needed cases such as:
- Direct traffic.
- Organic traffic.
- Web traffic.
- Mobile traffic.
If those appear in your property, use them when they answer the question.
You do not need to rebuild the same comparison manually.
Match Types Matter
Google supports different match types.
Examples include:
Exactly matches
and:
Does not exactly match
as well as partial matching options such as:
Contains
and:
Does not contain.
Google notes that partial-match phrases are case sensitive.
That detail can matter when you build text-based conditions.
Dimension Compatibility Matters
Not every dimension can be used with every report.
Google explains that some comparisons can produce blank cards when the report does not support the selected comparison condition.
Realtime is one area where this can occur more often.
Do not assume blank data means there were zero users.
The selected dimension and report may simply be incompatible.
Compare Before Changing the Website
Imagine mobile engagement appears lower.
Before redesigning anything:
- Compare mobile and desktop.
- Check landing pages.
- Check acquisition channels.
- Check browser/device technical performance.
- Test the actual mobile experience.
The GA4 Tech Details report guide can help determine whether the difference may relate to technology rather than audience intent.
Comparisons Do Not Establish Causation
This is the most important rule.
Suppose email visitors convert better than organic visitors.
You know:
Email visitors showed stronger measured outcomes.
You do not automatically know:
Email caused those people to become better customers.
People who join an email list may already be more interested.
The comparison is descriptive evidence.
Use experiments or deeper investigation for causal claims.
Avoid Percentage Drama
Example:
Desktop key-event rate:
4%
Mobile:
2%
You might write:
“Desktop converts 100% better.”
Mathematically, 4% is twice 2%.
But you still need:
- Number of users.
- Type of key event.
- Traffic source.
- Landing page.
- Statistical context.
A large percentage difference built from tiny numbers can be misleading.
Use Comparison as an Investigation Tool
A practical workflow is:
Step 1
Ask one question.
Step 2
Create two meaningful groups.
Step 3
Keep the date range identical.
Step 4
Compare the same metrics.
Step 5
Identify the largest meaningful difference.
Step 6
Open another report to investigate why it might exist.
Step 7
Take action only when supporting evidence exists.
This prevents the comparison itself from becoming the conclusion.
A Simple Comparison Worksheet
Record:
Question:
Comparison A:
Comparison B:
Date Range:
Users A / B:
Sessions A / B:
Engagement A / B:
Key Events A / B:
Largest Difference:
Possible Explanations:
Next Report to Check:
Action Yet?: Yes / No
The last field matters.
Sometimes the correct answer is:
No action yet. Investigate first.
Conclusion
GA4 comparisons help you evaluate subsets of website data side by side.
Use them for questions involving:
- Traffic sources.
- Devices.
- Countries.
- Platforms.
- Audiences.
- User behavior.
Keep the date range and metrics consistent.
Use compatible dimensions.
And remember:
A comparison tells you that a difference exists. It does not automatically tell you what caused it.
The best comparison is one that leads to a clearer next question.
Your Next Action
Open one standard GA4 report and create one comparison based on a real question.
A useful beginner example is:
All Users vs Organic Traffic
or:
Mobile vs Desktop
Keep the same date range.
Record only four metrics:
Users | Sessions | Engagement | Key Events
Then identify the single largest meaningful difference.
Do not change anything yet.
Write:
“I think this difference may be caused by ______.”
Then open one additional GA4 report that could test that explanation.
If the difference is device-related, check Tech Details.
If it is traffic-source related, check Acquisition.
If it is audience-related, check Audiences or Retention.
That turns GA4 comparisons from another colorful report into a structured investigation.