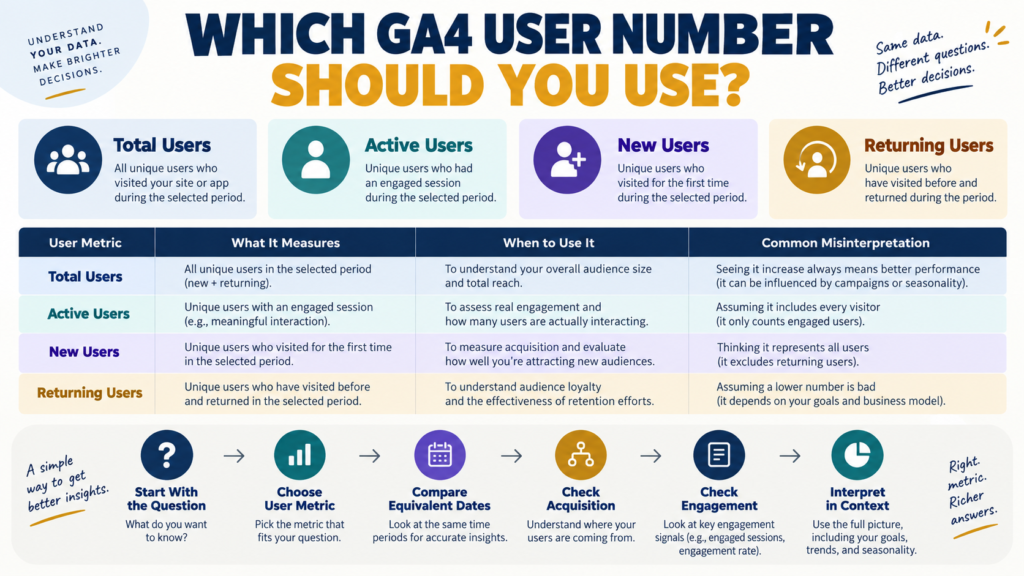
Google Analytics 4 can show several different user numbers.
Among the most common are:
- Total users.
- Active users.
- New users.
- Returning users.
That creates an understandable question:
Which number represents the number of people who visited my website?
The answer is:
It depends on what you are trying to measure.
Google’s current documentation defines the metrics differently. Total users represents unique users who triggered any event during the selected period. Active users represents unique users who engaged with the site or app under GA4’s active-user criteria. New users represents users associated with a first visit or first open. Returning users represents users who had initiated at least one previous session.
These are related metrics.
They are not interchangeable.
Start With Total Users
Total users is the broadest of the four concepts.
Google currently defines Total users as the number of unique users who triggered any event during the selected date range.
Use Total users when your question is:
How many unique users generated measured activity during this period?
That makes it useful as a broad audience-size metric.
What Is an Active User?
Google currently defines Active users as unique users who engaged with the site or app during the selected period.
For websites, active-user qualification can include an engaged session or collection of signals such as first_visit or engagement_time_msec.
This makes Active users a more engagement-oriented user metric.
A person can therefore appear in Total users without necessarily meeting the Active user criteria.
Why Total Users Can Be Higher
Imagine someone:
- Visits your site.
- Generates a measured event.
- Leaves almost immediately.
- Does not meet the active-user engagement criteria.
That person may still contribute to Total users while not appearing as an Active user under the relevant conditions.
This is one reason two user metrics do not necessarily match.
New Users
Google defines New users as new unique users associated with the first_visit event on a website or first_open in an app.
Use New users when your question is:
How many people are discovering the site for the first time?
This is particularly useful for:
- SEO.
- Advertising.
- Social campaigns.
- New content.
- Audience-growth efforts.
A rise in New users can indicate stronger discovery.
It does not automatically mean those visitors became engaged, subscribed, or purchased.
Returning Users
Returning users are users who previously initiated at least one session and then returned during the selected period under Google’s current definition.
Use Returning users when your question is:
How many people coming to the site have been here before?
This can be useful for:
- Content sites.
- Memberships.
- Ecommerce.
- Email-driven traffic.
- Resource libraries.
But returning traffic should still be interpreted according to the website’s purpose.
The GA4 Retention overview guide explains why not every successful visitor needs to return repeatedly.
New Users and Active Users Can Behave Differently
One surprising detail in Google’s documentation is that New users can sometimes exceed Active users.
That can happen because a new user is defined by a first-visit signal, while active-user status uses its own criteria.
So do not assume:
Active Users must always be higher than New Users.
The metrics measure different things.
Do Not Add New and Returning Users Together
A common mistake is to think:
New Users + Returning Users = Total Users
That calculation should not be treated as a guaranteed identity.
One person can interact with your site in ways that make category relationships more complicated across a date range.
GA4’s reporting, identity, thresholds, and user definitions should be allowed to determine the metrics.
Use the reported metrics instead of trying to reconstruct them from other columns.
Choose the Metric From the Question
This is the simplest approach.
Question: How large was the measured audience?
Use:
Total Users
Question: How many users meaningfully engaged under GA4’s active-user rules?
Use:
Active Users
Question: How many first-time users arrived?
Use:
New Users
Question: How many users came back?
Use:
Returning Users
Do not ask one metric to answer all four questions.
Example: Content Marketing
Suppose an article receives:
1,000 Total Users
850 Active Users
700 New Users
250 Returning Users
The useful story might be:
- The page attracted substantial new discovery.
- Most measured users qualified as active.
- Some returning audience activity also existed.
Do not automatically call the remaining difference “bad traffic.”
Investigate behavior before judging it.
Connect User Counts With Engagement
User counts tell you how many.
They do not tell you whether the visit was useful.
For that, examine:
- Engagement time.
- Engaged sessions.
- Views.
- Events.
- Key events.
The GA4 Engagement Overview guide provides a useful next layer.
The workflow becomes:
Users → Engagement → Business Outcome
Connect New Users With Acquisition
If New users increase, ask:
Where did they come from?
Possible sources include:
- Organic Search.
- Direct.
- Referral.
- Organic Social.
- Email.
- Paid traffic.
Use acquisition reports to investigate.
The GA4 User Acquisition vs Traffic Acquisition guide explains the difference between first-user acquisition and session acquisition.
Do Not Compare Different Metrics Across Periods
Weak comparison:
Last month Active Users: 2,000
versus:
This month Total Users: 2,400
Then concluding:
“Traffic increased 20%.”
Those are different metrics.
Compare:
Total Users vs Total Users
or:
Active Users vs Active Users
using equivalent date ranges.
Use the Same Date Range
If you are comparing user growth, keep the date ranges equivalent.
For example:
August 1–31
versus:
July 1–31
or:
Last 28 Days
versus:
Previous 28 Days
Avoid comparing 31 days with 14 days and then interpreting the totals as growth.
Small Sites Need Context
Suppose a small site has:
50 Active Users one week.
70 the next.
That is a 40% increase.
But it represents only 20 additional users.
Percentage growth can sound dramatic when the baseline is small.
Always read:
Percentage Change + Absolute Count
together.
Returning Users Need Business Context
A documentation article may attract many New users and few Returning users.
That may be perfectly healthy.
An online membership might expect a much higher Returning-user share.
The metric is not a score.
It is evidence about user behavior.
User Identification Is Not Perfect
Analytics does not literally know every human being with perfect certainty.
Measurement can depend on:
- Browser behavior.
- Device usage.
- Consent.
- Identity configuration.
- Data thresholds.
- Tracking implementation.
Treat user metrics as analytics measurements—not a census.
This is especially important when differences are small.
Create a Monthly User-Metric Snapshot
Once per month, record:
Total Users:
Active Users:
New Users:
Returning Users:
Top Acquisition Channel:
Most Important Change:
Possible Explanation:
Action Needed?:
This gives you trend context without watching the numbers every day.
What Should a Small Website Use Most Often?
For a simple monthly traffic review:
Start with:
Total Users
to understand overall measured audience size.
Then check:
New Users
for discovery.
Returning Users
for repeat behavior.
Active Users
for the engagement-oriented view.
After that, move to:
- Acquisition.
- Landing pages.
- Engagement.
- Key events.
The user number is only the beginning.
Conclusion
GA4’s user metrics answer different questions.
Use:
Total Users for the broad measured audience.
Active Users for users meeting GA4’s engagement-oriented active criteria.
New Users for first-time discovery.
Returning Users for repeat visitation.
Do not expect the numbers to match.
Do not add categories together and assume they must reproduce another metric.
And do not compare one user metric against another across different time periods.
The correct metric is the one that matches the question you are trying to answer.
Your Next Action
Open GA4 and choose one consistent period such as:
Last 28 Days
Record these four values:
Total Users: _____
Active Users: _____
New Users: _____
Returning Users: _____
Then write one sentence for each:
Total Users tells me…
Active Users tells me…
New Users tells me…
Returning Users tells me…
Finally, choose one metric you want to improve and investigate the next report that can explain it.
If New users are the concern:
Open Acquisition.
If Returning users are the concern:
Open Retention.
If Active users are the concern:
Open Engagement.
That turns four confusing numbers into one specific analytics question to investigate.