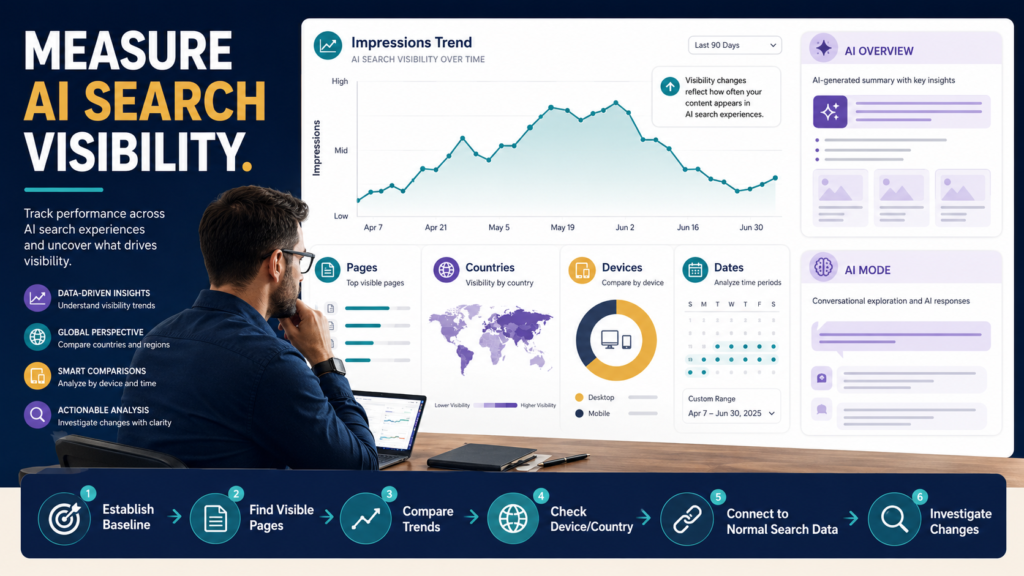
Google Search Console now provides website owners with a dedicated way to examine visibility inside supported generative AI experiences in Google Search.
That is an important change.
It is also easy to overinterpret.
Google’s current documentation says the Generative AI performance report (Search) was rolled out to websites worldwide as of August 31, 2026. The report focuses on impressions in supported generative AI Search features, currently including AI Overviews and AI Mode, and can break that visibility down by page, country, date, and device.
The best way to use the report is not to treat every AI impression as traffic or every change as an SEO verdict.
Use it as a visibility baseline.
Then connect what you see with your normal Search Console performance data, website analytics, content changes, and actual business outcomes before making major decisions.
Google’s official Generative AI performance report documentation should be your primary reference because this is a newly released feature and details may continue to evolve.
What the Report Actually Measures
The report is centered on impressions.
Google describes impressions here as the number of times links to your site were shown to a user in a supported generative AI feature.
That means:
An impression is evidence of visibility.
It is not automatically evidence of:
- A click.
- A website visit.
- A lead.
- A sale.
- A ranking improvement.
- A successful content strategy.
This distinction matters because the word “AI visibility” can sound more commercially meaningful than it may actually be.
Start by asking:
Where is my site appearing?
not:
How much money did AI search generate?
Which AI Search Experiences Are Included?
Google’s current documentation lists:
- AI Overviews.
- AI Mode.
Google also notes that the supported list may change as Search develops and that experimental Search Labs data is not included in this report.
This makes the report a defined measurement tool rather than a universal record of every possible AI-related Google experience.
If Google expands the report later, use current documentation rather than assuming today’s coverage remains permanent.
Why This Report Matters
Before dedicated reporting, site owners often had to infer AI visibility indirectly.
Now you can begin to answer questions such as:
- Is my site appearing in supported generative AI Search features?
- Which pages receive the most AI impressions?
- Is visibility increasing or decreasing over time?
- Are impressions concentrated in certain countries?
- Is mobile visibility different from desktop?
- Did a particular content update coincide with a visibility change?
These are useful questions.
They are still visibility questions.
Start by Establishing a Baseline
Because the report is new, resist the urge to overreact to the first numbers you see.
Record:
- Date range.
- Total impressions.
- Pages appearing.
- Main countries.
- Main devices.
- Any obvious concentration of visibility.
Then revisit the report later.
A baseline lets you compare:
September 3 → October 3
rather than reacting to:
Yesterday → Today
The new report can include preliminary recent data, and Google says the newest information may still change while collection is being completed.
Use the Pages Dimension First
For most content-focused websites, the Pages dimension may be the most useful starting point.
Ask:
Which pages are actually appearing in generative AI Search features?
You may discover that visibility is concentrated in:
- Detailed tutorials.
- Product comparisons.
- How-to articles.
- Definition pages.
- Troubleshooting guides.
- Original research.
- Resource pages.
Do not immediately copy the format of the page with the most impressions.
Instead, investigate why that page may be useful.
Look at:
- Search intent.
- Content depth.
- Originality.
- Structure.
- Clear explanations.
- Supporting evidence.
- Topic authority.
- Internal links.
- Freshness.
Then compare it with similar pages that have little or no AI visibility.
Do Not Treat the Report as a Ranking Report
Traditional SEO thinking often asks:
“What position am I ranking?”
That is not the right interpretation here.
A generative AI search experience may assemble information differently from a traditional list of ten blue links.
The useful question is:
Was my page shown as a linked source or result within the supported generative AI experience?
Trying to convert every AI impression into a traditional rank number can create false precision.
Compare AI Visibility With Normal Search Performance
This is where the report becomes more useful.
Suppose one article has rising AI impressions.
Open your normal Search Console performance data.
Check:
- Total clicks.
- Total impressions.
- CTR.
- Queries.
- Page performance.
- Device.
- Country.
- Date trend.
Now ask:
Did normal search visibility change too?
Or is the AI visibility trend behaving differently?
My guide to Search Console Search Appearance explains a similar principle: specialized Search Console dimensions need to be interpreted within their measurement rules rather than being treated as direct substitutes for total search performance.
Compare With GA4 Carefully
Search Console and GA4 measure different parts of the journey.
Search Console tells you about visibility and clicks associated with Google Search reporting.
GA4 measures activity that is actually recorded on your website or app.
That means a rise in AI impressions does not automatically create an equal rise in:
- Sessions.
- Users.
- Engaged sessions.
- Leads.
- Sales.
If the numbers appear inconsistent, remember the broader lesson in why Search Console and GA4 traffic numbers do not match.
Different measurement systems answer different questions.
Use the Country Dimension for Context
A visibility increase may come primarily from one country.
That could matter if your business serves:
- One country.
- Several countries.
- A local market.
- An international audience.
Imagine AI impressions rise 80%, but most of the additional visibility comes from a market your product does not serve.
The increase is still interesting.
It may not be commercially important.
Always connect visibility with audience fit.
Use the Device Dimension
The report can group generative AI Search impressions by:
- Desktop.
- Tablet.
- Mobile.
Google’s current documentation identifies device as one of the report’s available dimensions.
This allows you to ask:
Is most AI visibility happening on mobile?
Is desktop visibility growing differently?
Do certain important pages show a different device pattern?
Again, treat this as a diagnostic clue rather than proof that a device is causing the result.
Watch Aggregation Differences
Google notes that the report chart and table can sometimes show different totals because aggregation changes depending on how the data is grouped.
The chart may aggregate at the property level, while page-grouped table data is aggregated by page.
That means:
Chart total ≠ sum of every visible page row
does not automatically indicate a tracking problem.
Before troubleshooting, read how the report aggregates the selected dimension.
This is the same discipline required across many analytics tools:
Understand the measurement rule before judging the number.
Do Not Chase Every AI Impression
Suppose one article receives 1,000 AI impressions and another receives 100.
That does not automatically mean you should rewrite the second article to resemble the first.
The pages may answer different searches.
They may have different commercial importance.
One may serve existing customers.
One may target a smaller but more valuable problem.
One may be new.
One may not naturally belong in an AI-generated search response.
Content strategy should still begin with usefulness.
A Practical Weekly Review
For a small website, a simple process could be:
Step 1
Record total generative AI impressions.
Step 2
Identify the top pages.
Step 3
Look for meaningful changes—not tiny daily fluctuations.
Step 4
Check country and device context.
Step 5
Open normal Search Console performance for affected pages.
Step 6
Check GA4 for actual website behavior.
Step 7
Investigate only when a pattern is meaningful.
This prevents the new report from becoming another dashboard you feel obligated to watch every hour.
What to Investigate When Visibility Changes
If a strong pattern appears, check:
- Was content updated?
- Did Google recrawl the page?
- Was a competing page published?
- Did normal impressions change too?
- Did query demand change?
- Did the affected pages share a topic?
- Was the change limited to one country?
- Was it limited to one device?
- Is the newest data preliminary?
Avoid immediately concluding:
“Google’s AI loves my site.”
or:
“AI Search stopped recommending me.”
Those conclusions go beyond what one visibility chart can prove.
Keep Your Existing SEO Fundamentals
A new AI report does not invalidate ordinary SEO.
Continue working on:
- Helpful content.
- Search-intent alignment.
- Clear headings.
- Accurate information.
- Internal linking.
- Page experience.
- Crawlability.
- Indexing.
- Useful titles.
- Appropriate structured data.
- Strong site organization.
If you need to investigate whether an important page is even available to Search correctly, use the Search Console URL Inspection workflow rather than assuming an AI-report issue is the cause.
Conclusion
Google’s Generative AI performance report provides something publishers have wanted for a long time: first-party visibility information for supported generative AI Search experiences.
But the report should be used for the job it actually performs.
It measures AI-search visibility through impressions and allows analysis by pages, countries, dates, and devices.
It does not turn every impression into traffic, a ranking, a lead, or a sale.
Start by establishing a baseline.
Identify which pages appear.
Compare meaningful trends over time.
Then connect those trends with normal Search Console data, GA4 behavior, and business outcomes.
The best first action is simple:
Open the report, record today’s baseline, and resist changing anything until you have enough information to identify a meaningful pattern.