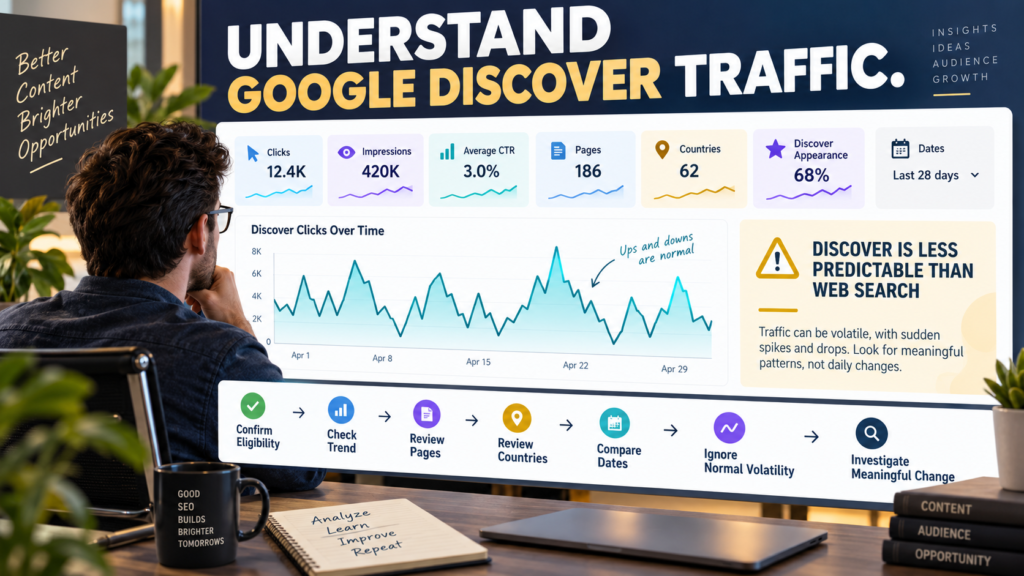
Google Discover can send significant traffic to some websites.
But Discover does not behave exactly like normal Google Search.
Traditional Search usually begins with a user typing or speaking a query.
Discover proactively recommends content based on users’ interests and other signals.
Google’s current Search Console documentation specifically notes that Discover traffic is less predictable than Search traffic partly because it is proactively served instead of depending on a search query.
That means a Discover traffic spike can be exciting.
It can also disappear quickly.
The correct workflow is:
Check Trend → Identify Pages → Check Countries → Compare Dates → Understand Volatility → Investigate Meaningful Patterns
Not Every Site Gets the Discover Report
Google says the Discover Performance report is shown only when a property reaches a minimum level of Discover impressions.
Therefore, if the report is absent, do not assume:
- Search Console is broken.
- Your property is configured incorrectly.
- Google manually blocked the site.
You may simply not have enough qualifying Discover activity.
The Main Discover Metrics
The current report provides:
- Clicks.
- Impressions.
- Average CTR.
These look familiar because Search Console uses similar concepts in Web Search.
But the underlying discovery environment is different.
What Counts as a Discover Impression?
Google’s current documentation says a Discover impression occurs when the item is scrolled into view under its measurement rules.
That means:
Impression
does not mean:
“Someone carefully read the headline.”
It means the result was shown under Google’s defined measurement conditions.
Clicks
A click occurs when a user clicks the Discover item.
Sharing or another action does not necessarily count as a click under Google’s Discover definition.
This distinction matters if a piece of content is widely shared.
Search Console is reporting its own defined interaction metric—not every downstream action.
CTR
Average CTR is:
Clicks ÷ Impressions.
CTR can help compare performance.
But avoid setting a universal target.
Discover content types and audiences vary.
A useful approach is to compare:
- Page with its own history.
- Similar Discover pages.
- Equivalent time ranges.
Group by Page
The Pages view helps identify which URLs receive Discover visibility.
This may reveal that Discover favors different content from traditional Search.
For example:
Normal Web Search may strongly favor:
- Evergreen tutorial.
- How-to guide.
- Software comparison.
Discover may temporarily favor:
- Timely article.
- Visual story.
- Current-interest content.
Do not assume every successful Search page should also succeed in Discover.
Canonical URLs Matter
Google currently assigns Discover page metrics to canonical URLs.
If several duplicate or alternate versions exist, performance may appear under the canonical page rather than the exact URL you expected.
This is important when troubleshooting missing page data.
Group by Country
The Discover report also allows country grouping and filtering.
This can reveal whether a traffic surge was concentrated in:
- United States.
- Canada.
- United Kingdom.
- Another market.
Geographic concentration can explain why a sitewide traffic spike may not repeat.
Discover Appearance
Google’s current report supports Discover appearance categories including supported formats such as AMP articles, News Showcase, Web Stories, and videos where applicable.
Not every website will use every appearance type.
Do not create a new format solely because the report contains a tab for it.
Date Analysis Is Especially Important
Discover traffic can change rapidly.
Google’s current report defaults to the last three months but supports changing the date range. It also supports different time granularities including daily, weekly, and monthly, with hourly information available in the 24-hour view.
For long-term analysis:
Weekly and monthly trends can be more informative than individual daily spikes.
The 24-Hour View Contains Preliminary Data
Google notes that the 24-hour Discover view includes preliminary data, which can change as collection continues.
Do not make major content decisions because one recent hour looks unusually weak.
The same caution applies to Search Console’s broader recent-data reporting.
See how to use Search Console’s 24-hour view without overreacting to preliminary data.
Discover Spikes Can Be Normal
Suppose:
Monday: 200 clicks.
Tuesday: 4,000.
Wednesday: 900.
Thursday: 300.
The Tuesday spike may not mean:
“SEO increased 1,900%.”
It may mean one article received unusually strong Discover distribution.
Open the Pages dimension.
Which URL created the spike?
Investigate the Page Before the Whole Site
If one article generates 80% of Discover clicks:
Your sitewide Discover chart is mostly showing that one page.
Do not redesign the whole website.
Analyze:
- Topic.
- Publication timing.
- Visuals.
- Headline.
- Country.
- Discover appearance.
Then ask whether there is a repeatable lesson.
Do Not Expect Search Queries
One of the biggest differences between Web Search and Discover is the absence of a traditional query dimension in the standard Discover report.
Discover is not primarily triggered by the user entering a specific query.
Therefore, do not approach it as:
“What keyword did I rank for?”
Approach it as:
“Which content received distribution to interested users?”
Compare Discover With Web Search Separately
Do not mix:
Discover clicks
with:
Web Search clicks
and call the total:
“SEO clicks.”
They represent different discovery environments.
The newly verified guide to comparing Web, Image, Video, and News search types reinforces the broader principle:
Different Google surfaces deserve separate interpretation.
Discover is another distinct surface.
Discover Traffic May Be Volatile Even When Web Search Is Stable
Example:
Web Search:
Stable around 1,000 clicks per week.
Discover:
6,000 → 800 → 4,000 → 500.
The website’s core organic Search performance may be stable while Discover fluctuates.
That is why you should not interpret every overall traffic movement as a ranking change.
Check GA4 Too
Search Console reports the Discover click.
GA4 can help show what those visitors did after arriving.
Ask:
- Did they engage?
- Which pages did they view?
- Did they subscribe?
- Did they generate key events?
- Did they return?
Search visibility and website behavior are different measurements.
Beware of Small Baselines
A jump from:
5 clicks
to:
50 clicks
is:
900% growth.
That percentage sounds enormous.
But the absolute numbers remain small.
Always read both percentage and count.
Table Rows Have Limits
Google’s current Discover table is limited to 1,000 rows. Google also uses minimum impression thresholds for some individual table rows, although below-threshold data can still contribute to totals.
Therefore, manually adding the visible table rows may not reproduce every total exactly.
Understand the report’s limitations before assuming data is missing.
Use Search Console Insights for Broader Discovery
If you prefer a higher-level view of changing content and traffic, the Search Console Insights report can complement the detailed Discover report.
Insights is useful for spotting patterns.
The Discover Performance report is better for focused Discover analysis.
A Practical Discover Review
Step 1: Use at least several weeks of data
Avoid judging from one day.
Step 2: Review clicks and impressions
Look for broad patterns.
Step 3: Open Pages
Identify which URLs drive changes.
Step 4: Check Country
See whether activity is geographically concentrated.
Step 5: Check Discover Appearance
Use it when enough data exists.
Step 6: Compare equivalent periods
For example:
Last 28 Days vs Previous 28 Days.
Step 7: Check GA4
Determine whether Discover visitors created meaningful website behavior.
Step 8: Record the lesson
Was the result:
- One-time spike?
- Repeating topic?
- Seasonal pattern?
- Growing Discover presence?
Do Not Turn One Discover Win Into a Content Strategy
A page receiving 100,000 Discover clicks does not prove that twenty copies of the same article will perform.
Discover distribution depends on many factors outside your direct control.
Learn from patterns.
Do not manufacture certainty.
Conclusion
The Search Console Discover Performance report can show:
- Clicks.
- Impressions.
- CTR.
- Pages.
- Countries.
- Discover appearance.
- Date trends.
But Discover should not be interpreted exactly like normal Web Search.
Its distribution is more proactive and can be much more volatile.
When traffic changes:
Open the Pages report first.
Determine whether one page caused the movement.
Then review country, date, appearance, and post-click behavior.
The best question is not:
“Why did SEO suddenly explode?”
It is:
“What content received Discover distribution, and is there a repeatable pattern worth learning from?”