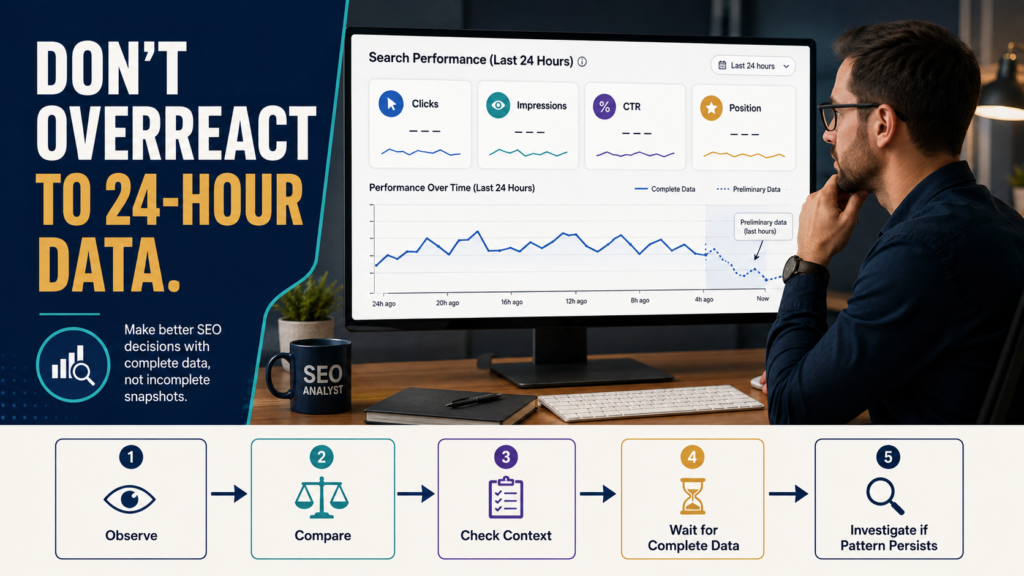
Google Search Console’s 24-hour Performance view gives website owners a much faster look at recent search activity than relying only on completed daily data.
That is useful when you have just published something, changed an important page, noticed unusual traffic, or want to see whether search activity is moving.
But faster data creates a new risk:
reacting to incomplete data as though it were a final trend.
Google’s current Search Console documentation says recent Performance data can be preliminary and may change as collection continues. The 24-hour view uses hourly data and displays time according to the browser’s local time, while the standard Performance views use Pacific Time. The table is also unavailable in the 24-hour view.
The right way to use the view is therefore:
Spot a possible change quickly → examine context → compare intelligently → wait for enough evidence → investigate only when the pattern deserves it.
What the 24-Hour View Is Good For
The view can help answer short-term questions such as:
- Did today’s new article begin receiving impressions?
- Did search activity change after a website problem?
- Is a sudden drop continuing?
- Is an unusual spike limited to one hour?
- Which recent period appears different?
- Did branded search activity change after a promotion?
- Are clicks starting to return after a technical fix?
Think of it as an early-warning and observation tool, not a final SEO scorecard.
Preliminary Does Not Mean Useless
Some website owners see the word “preliminary” and assume the newest data should be ignored.
That is not necessary.
Preliminary data can be useful as long as you understand the limitation.
Google explains that the newest Search Console data may still be collected and adjusted.
A dotted or incomplete section should therefore trigger:
“Keep watching.”
not:
“Something is definitely wrong.”
Why Hourly Search Data Can Look Dramatic
Imagine a website usually gets most of its Google clicks between 8 AM and 9 PM.
At 7 AM, today’s chart may look far weaker than yesterday’s completed day.
That does not mean SEO collapsed overnight.
You are comparing:
a partial day
with:
a complete day.
Hourly data also naturally fluctuates.
Search demand changes with:
- Work schedules.
- Weekdays and weekends.
- News.
- Holidays.
- Seasonality.
- Time zones.
- Device usage.
- Promotional activity.
- Individual queries.
Small websites experience even more visible percentage swings because the underlying numbers are smaller.
Rule 1: Compare Equivalent Periods
Do not compare the first four hours of today with all of yesterday.
Compare similar windows.
For example:
Today 8 AM–12 PM
versus
Yesterday 8 AM–12 PM
Even then, treat the comparison as directional rather than conclusive.
Rule 2: Look at Impressions and Clicks Together
Suppose clicks decline but impressions remain stable.
Possible explanations include:
- Lower click-through rate.
- Different queries.
- Different rankings.
- Search-result changes.
- Normal variation.
If both impressions and clicks drop sharply, you have a different signal.
Metrics tell a more useful story when examined together.
Rule 3: Do Not Treat Average Position Like a Stock Price
Average position can move because the mix of queries and pages changed.
A website beginning to appear for many new lower-ranking queries can show a weaker average position even while gaining visibility.
Likewise, losing impressions for lower-ranking queries can make average position appear better without producing meaningful growth.
Use position as context.
Do not automatically change pages because a few hours of average position moved.
Rule 4: Watch for Persistent Patterns
A single unusual hour is noise until evidence says otherwise.
A practical escalation sequence is:
One Unusual Hour
Observe.
Several Similar Hours
Check whether the pattern continues.
A Complete Day
Compare with normal days.
Several Days
Investigate causes.
Clear Sustained Decline
Begin structured diagnosis.
This protects the website from unnecessary reactions.
If a decline becomes persistent, use a deliberate process such as diagnosing a drop in Google Search traffic before changing the website instead of editing pages at random.
Rule 5: Separate Sitewide Changes From Page-Level Changes
If the 24-hour chart looks unusual, ask:
Is this happening across the website or only to one important page?
A sitewide decline could justify checks for:
- Server availability.
- Robots restrictions.
- Accidental noindex.
- Broad technical problems.
- Search-demand change.
A page-level decline could involve:
- Query mix.
- Competition.
- Page changes.
- Canonicalization.
- Indexing.
- Normal demand variation.
For one suspicious URL, the Search Console URL Inspection troubleshooting workflow is a more appropriate diagnostic step than making sitewide SEO changes.
Rule 6: Remember the Time-Zone Difference
Google’s current documentation states that the 24-hour view uses the user’s local browser time, while standard Search Console date views use Pacific Time.
This can create confusion when you compare:
- Search Console.
- GA4.
- Server logs.
- Affiliate dashboards.
- Sales records.
- Advertising platforms.
If numbers seem shifted across days, check time zones before diagnosing a traffic problem.
A Practical 24-Hour Monitoring Workflow
Step 1 — Open Performance
Start with search results and the 24-hour range.
Step 2 — Look at the Overall Shape
Do not begin by staring at a single number.
Ask:
- Is activity broadly normal?
- Is there a clear spike?
- Is there a sustained gap?
- Is only the newest incomplete section different?
Step 3 — Check Clicks and Impressions
Determine whether both changed.
Step 4 — Look for Context
Consider:
- Time of day.
- Day of week.
- Recent publication.
- Site changes.
- Promotions.
- Known outages.
- Seasonal demand.
Step 5 — Note the Signal
Write one sentence:
“Impressions appear lower during the morning, but current data is preliminary.”
This prevents a visual reaction from becoming a premature conclusion.
Step 6 — Recheck Later
See whether the pattern persists.
Step 7 — Escalate Only if Necessary
Move into deeper troubleshooting after enough evidence exists.
When the 24-Hour View Is Especially Helpful
After Publishing New Content
You may be able to see early impressions without waiting as long for completed daily reporting.
Do not interpret early impressions as proof of future ranking.
After Fixing a Technical Problem
You can watch for early signs that activity is returning.
During a Suspected Outage
The view can help determine whether search clicks dropped during the affected period.
After a Major Site Change
Use it as one layer of monitoring.
Do not judge an SEO migration, redesign, or structural change from a few hours of activity.
During a Traffic Spike
The view can help identify approximately when the spike began.
Then investigate which queries, pages, referrals, campaigns, or outside events may explain it.
What the 24-Hour View Cannot Tell You by Itself
It cannot automatically tell you:
- Why rankings changed.
- Whether a page needs rewriting.
- Whether an algorithm update affected you.
- Whether competitors improved.
- Whether conversions increased.
- Whether visitors were engaged.
- Whether a traffic decline is permanent.
Those questions require additional evidence.
Search Console shows search visibility and clicks.
Other tools answer other parts of the story.
Do Not Refresh Search Console All Day
Access to fresher data can create a new form of busywork.
For most small websites, you do not need hourly SEO management.
A healthier approach might be:
Normal days: review broader trends on a scheduled basis.
After an important event: use the 24-hour view for temporary monitoring.
If something looks wrong: record it and recheck.
If the issue persists: diagnose systematically.
This keeps the tool useful rather than distracting.
A Simple Decision Checklist
When the latest data looks alarming, ask:
- Is the data preliminary?
- Am I comparing equivalent time periods?
- Is the difference large enough to matter?
- Are impressions and clicks both affected?
- Is one page responsible?
- Is one query responsible?
- Could time of day explain it?
- Could day of week explain it?
- Was anything changed recently?
- Is the pattern still present after more data arrives?
If you cannot answer those questions yet, you probably do not have enough evidence to redesign the page.
Conclusion
Search Console’s 24-hour view is valuable because it shortens the time between an event and your ability to observe search activity.
Its value comes from faster awareness, not faster panic.
Use hourly data to identify possible changes, compare equivalent periods, remember that the newest data may be preliminary, and give unusual patterns enough time to prove they are real.
When a change persists, move from observation into structured diagnosis.
That approach turns faster Search Console data into a decision tool instead of another dashboard to worry about.