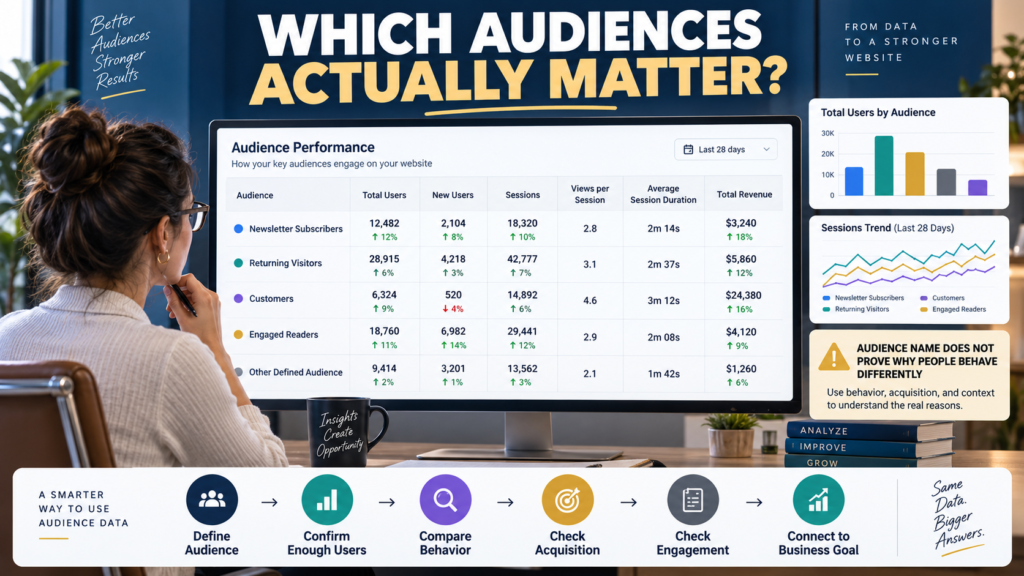
Google Analytics 4 lets you create audiences based on user characteristics or behavior.
Examples might include:
- Returning visitors.
- Purchasers.
- Newsletter subscribers.
- Highly engaged visitors.
- Users from a specific campaign.
- Visitors who completed an important action.
GA4’s current Audiences report is a prebuilt detailed report that includes audiences with at least one user during the selected period. Google’s current path is Reports → User attributes → Audiences, although administrators or editors can add the report if it is not currently in the navigation.
The report can help answer:
Which defined groups behave differently after reaching the website?
But there is an important warning:
An audience label does not explain why that audience performs differently.
What GA4 Audiences Are
An audience is a defined group of users who share selected characteristics or behaviors.
For example:
Audience A: Users who purchased.
Audience B: Users who viewed five or more pages.
Audience C: Users who returned within 30 days.
The rules used to create the audience matter.
If you create a weak audience definition, the report will faithfully analyze a weak audience.
The Report Is Not Automatically Populated With Every Useful Business Group
You first need meaningful audiences.
Do not create twenty audiences simply because GA4 allows it.
Start with business questions.
Examples:
Do customers behave differently from noncustomers?
Do returning users engage more than first-time visitors?
Do highly engaged readers eventually generate more revenue?
Each question can justify an audience.
Current Metrics in the Audiences Report
Google’s current default report includes metrics such as:
- Total users.
- Average session duration.
- New users.
- Sessions.
- Views per session.
- Total revenue.
Those metrics help compare size, activity, engagement, and monetization.
But no single metric determines value.
Start With Total Users
Total users tells you how many distinct users from an audience visited during the selected period.
This gives context.
Suppose:
Audience A: 50 users.
Audience B: 5,000 users.
If Audience A has an unusually high revenue-per-user pattern, that may be interesting.
But the smaller sample also deserves caution.
Do not compare percentages without checking how many people generated them.
New Users Can Reveal Audience Entry
The New users metric shows how many users in the audience interacted with the site or app for the first time.
This may be more relevant for some audiences than others.
For example:
A returning-customer audience should naturally contain different new-user behavior from a general visitor audience.
Do not assume every metric should be maximized for every group.
Sessions
Sessions provide another view of activity.
Two audiences could contain the same number of users but very different session counts.
Example:
Audience A:
1,000 users and 1,100 sessions.
Audience B:
1,000 users and 2,400 sessions.
Audience B appears to return or interact more frequently.
That gives you a question to investigate.
It does not prove Audience B is more profitable.
Views per Session
Views per session tells you how many pages or screens audience members viewed during their sessions, with repeated views included under Google’s current definition.
This can be useful for content-heavy sites.
But a higher number can mean different things:
- Visitors are exploring.
- Navigation encourages discovery.
- They are having trouble finding what they need.
Open the relevant page reports before deciding which interpretation makes sense.
The GA4 Pages and Screens guide can help connect audience behavior with specific content.
Average Session Duration
Average session duration can help compare how long sessions from different audiences tend to last.
Again, longer does not automatically equal better.
For an educational website:
Longer may indicate reading.
For a checkout page:
Longer could indicate friction.
Always connect the metric to the user’s intended task.
Total Revenue
GA4’s current Audiences report can include total revenue associated with users in each audience when the relevant revenue data is available. Google’s definition includes revenue from purchases and certain other supported monetization sources.
This can be extremely useful for ecommerce businesses.
But revenue without context can mislead.
Example:
Audience A:
$20,000 revenue from 10,000 users.
Audience B:
$10,000 revenue from 500 users.
Which audience is more valuable?
That depends on:
- Revenue per user.
- Acquisition cost.
- Customer type.
- Retention.
- Business objective.
Audience Membership Rules Matter
Suppose you create:
High-Value Customers
defined as:
Users who already spent more than $500.
Then you notice:
High-Value Customers generate more revenue than General Visitors.
That is not surprising.
Your audience definition already selected people based partly on value.
Do not present the result as though GA4 discovered a mysterious new pattern.
Always read the audience definition before interpreting the metrics.
Historical Audience Membership Needs Careful Interpretation
Google notes that current user behavior does not retroactively change historical audience membership in reports in the way someone might casually expect.
This is another reason to understand how the audience was configured and when it began collecting users.
If you recently created an audience, do not assume it contains a complete historical record for every behavior you wish you had tracked.
Compare Audiences With a Business Question
Weak analysis:
“Customer audience has more revenue.”
Better:
“Do users who joined through our lead magnet generate more sessions and eventual revenue than general visitors?”
Now you have a useful comparison.
Audience Example: Engaged Readers
Suppose you define an audience around meaningful engagement.
Then compare:
- Total users.
- Sessions.
- Views per session.
- Revenue.
If engaged readers later generate stronger business outcomes, you may have evidence that deeper content engagement matters.
But be careful about circular definitions.
If your audience definition includes a key event, it should not be surprising when the audience has more key-event behavior.
Audience Example: Returning Visitors
Returning visitors may help answer:
Does repeat exposure matter?
Compare their:
- Sessions.
- Engagement.
- Revenue.
- Content consumption.
Then connect the results with retention reporting and acquisition.
Connect Audiences With Acquisition
Audience behavior often depends on how people first found the site.
A newsletter audience may behave differently from paid-social visitors.
An organic-search audience may contain people with very different intent.
Use acquisition reports to investigate.
My GA4 User Acquisition vs Traffic Acquisition guide explains the difference between first-user and session-level acquisition.
Connect Audiences With Engagement
If an audience appears valuable, ask:
What are they doing?
The now-verified GA4 Engagement Overview guide can help you interpret engagement without treating every interaction as a business result.
Audience analysis becomes more useful when you connect:
Who they are in your GA4 definition
with:
How they arrived
and:
What they did.
Do Not Create Audiences From Sensitive Assumptions
Use appropriate data practices.
Do not create audience labels that imply personal information you do not actually know.
Analytics categories should be grounded in measurable behavior or legitimate configured attributes.
Examples:
Good:
Purchased Product A
Good:
Visited 3+ Times
Weak:
People Who Are Probably Wealthy
The last label invents a personal characteristic.
Audience Exports Can Differ From GA4 Reporting
Google warns that significant differences can occur when audiences are exported to other products such as Google Ads.
Therefore, do not assume:
Audience count in GA4
must exactly equal:
Audience size displayed in another advertising product.
The systems may use different eligibility and processing rules.
Build Fewer, Better Audiences
For a small website, begin with three or four.
Example:
Audience 1: Returning Visitors
Question:
Do repeat visitors behave differently?
Audience 2: Lead-Generation Completers
Question:
What do people who become leads do before and after conversion?
Audience 3: Customers
Question:
How does customer website behavior differ?
Audience 4: Highly Engaged Readers
Question:
Does deeper content consumption relate to business outcomes?
That is enough for useful analysis.
A Simple Audience Review Worksheet
Audience Name:
Audience Definition:
Date Created:
Total Users:
New Users:
Sessions:
Views per Session:
Average Session Duration:
Revenue:
Primary Acquisition Source:
Important Content:
Business Question:
Action Needed?:
The Audience Definition field is essential.
Never analyze the label without understanding the rule.
Conclusion
The GA4 Audiences report can help you compare meaningful groups of users using metrics such as:
- Users.
- Sessions.
- Views per session.
- Session duration.
- Revenue.
But the report is only as useful as the audience definitions behind it.
Do not create audiences simply to fill a dashboard.
Start with a business question.
Define the audience carefully.
Compare its behavior.
Then investigate acquisition, engagement, content, and revenue where relevant.
The most useful question is not:
“Which audience has the biggest number?”
It is:
“Which audience behavior helps me understand how people move toward a meaningful business outcome?”