A page can receive thousands of views without being one of the main places where visitors enter your website.
That distinction is important.
If you want to understand where sessions begin, the GA4 Landing page report is more useful than simply sorting all website pages by views.
Google defines a landing page as the page associated with the first pageview in a session. Its current GA4 Landing page report documentation describes the report as a pre-made detail report designed to show the first pages visitors land on and how people interact after arriving.
For a small website, the practical purpose is straightforward:
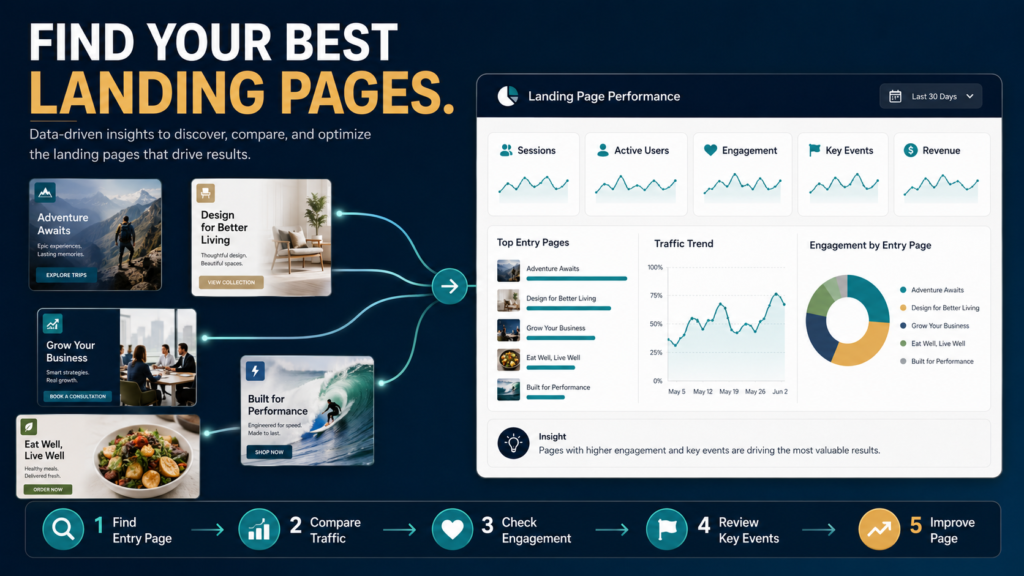
Use the Landing page report to identify important entry pages, then compare traffic, engagement, key events, and traffic sources before deciding which pages deserve improvement.
Landing Pages Are Not the Same as Your Most-Viewed Pages
This is one of the most important distinctions in GA4.
Imagine a visitor enters your website through a blog article, clicks to your homepage, visits a resource page, and then reaches a product page.
All four pages may receive views.
Only the blog article was the landing page for that session.
That is why the Landing page report answers a different question from the Pages and Screens report.
The Landing page report asks:
Where did the session begin?
The Pages and Screens report asks:
Which pages were viewed during user activity?
If you need the second question, see my guide to using the GA4 Pages and Screens report without confusing views with landing pages.
Where to Find the Landing Page Report
According to Google’s current desktop instructions, the standard path is:
Reports → Engagement → Landing page
If you do not see the report, Google notes that it may have been removed or may not be included in your current navigation configuration. Users with the appropriate Editor or Administrator access can add reports back.
Interface configurations can vary, so use Google’s current documentation rather than assuming every account will look identical.
Start With a Useful Date Range
Before analyzing individual pages, choose a date range that matches the decision you are trying to make.
For example:
Last 7 days can help with a recent campaign.
Last 28 or 30 days can provide a broader view of normal traffic.
Last 90 days may help when a smaller website has limited traffic.
Avoid making major decisions from an extremely short period unless you have enough data to justify them.
A page that received three sessions yesterday should not automatically be labeled a winner or failure.
Look for patterns.
Metric 1: Sessions
Sessions tell you how many sessions began on the website or app during the measured period.
In the context of a landing-page analysis, this helps you understand which pages are functioning as meaningful entry points.
A page with high landing-page sessions may be receiving traffic from:
- Organic search.
- Email.
- Social media.
- Referrals.
- Paid campaigns.
- Direct visits.
- Other tracked sources.
High sessions tell you the page is attracting entry traffic.
They do not tell you whether that traffic is useful.
That requires more investigation.
Metric 2: Active Users
Active users help you understand the number of distinct users who engaged with the site or application.
Do not treat sessions and active users as interchangeable.
One person can generate more than one session.
For a simple website review, the relationship between these metrics can give you useful context about how much visitor activity is associated with the landing page.
Metric 3: Average Engagement Time per Session
Traffic without engagement may deserve attention.
Google’s Landing page report can include Average engagement time per session, which measures the average amount of time the website was in focus or the app was in the foreground during sessions.
Suppose:
Page A receives 1,000 landing-page sessions.
Page B receives 400.
At first glance, Page A appears stronger.
But if Page B consistently produces deeper engagement and more meaningful actions, it may be more valuable to the business.
Traffic volume is only the beginning of the analysis.
Metric 4: Key Events
A key event is an event you have designated as important to the business.
Possible examples might include a completed lead form, a purchase, or another meaningful action you have deliberately configured and marked as a key event.
Do not assume every event deserves key-event status.
Your measurement plan should focus attention on actions that actually matter.
If you are still deciding what deserves special attention, my guide to measuring blog performance in GA4 without relying on page views alone provides a broader framework.
Metric 5: Revenue When It Applies
For websites with properly configured ecommerce or revenue tracking, GA4 can also report total revenue.
That can help separate:
Pages that attract visits
from:
Pages that begin sessions associated with business results.
For a content site that does not sell directly through tracked ecommerce, this metric may be less useful than leads, email signups, engagement, or another appropriately configured key event.
Choose metrics that match your business model.
Add Traffic Source Context
Knowing that a landing page attracts sessions becomes much more useful when you understand where those sessions originate.
Google’s current documentation describes two useful approaches.
You can add Session source / medium as a secondary dimension in the Landing page report.
Or you can work from Traffic Acquisition and combine session-source information with landing-page dimensions.
For example, a blog article might receive:
- Organic Google traffic.
- Newsletter traffic.
- Facebook traffic.
- Direct visits.
Each source may behave differently.
If you only look at the page total, those differences disappear.
A Practical Landing-Page Review Workflow
Here is a simple process for a small website.
Step 1: Sort by Sessions
Identify the pages responsible for meaningful entry traffic.
Do not immediately change anything.
Build the list first.
Step 2: Compare Engagement
Look at engagement-related metrics.
Ask:
- Are visitors staying long enough to consume the page?
- Are there obvious pages with strong traffic and unusually weak engagement?
- Are lower-traffic pages producing surprisingly good engagement?
Step 3: Review Important Actions
Check your relevant key events.
A landing page may be doing its job even if visitors leave that page quickly because they are moving to another page that completes the journey.
Step 4: Add Source or Medium
Determine which channels are creating the traffic.
A page attracting organic search visitors may require a different improvement strategy from one receiving most of its visits from a tightly targeted email campaign.
Step 5: Inspect the Page Itself
Analytics tells you where to investigate.
It does not automatically tell you the cause.
Open the page.
Review:
- Search-intent match.
- Headline.
- Introduction.
- Page speed.
- Mobile experience.
- Calls to action.
- Navigation.
- Broken links.
- Offer relevance.
- Content depth.
- Trust signals.
Step 6: Make One Reasoned Improvement
Avoid redesigning five elements simultaneously.
Choose the most plausible problem.
Improve it.
Then measure again.
Four Landing-Page Patterns Worth Investigating
High Traffic + Strong Results
These pages may be valuable assets.
Instead of immediately changing them, ask how you can support them.
Could you improve internal links?
Could you make the next action clearer?
Could you create related content?
High Traffic + Weak Results
These deserve investigation.
Possible causes include:
- Search-intent mismatch.
- Weak next step.
- Poor mobile usability.
- Slow load time.
- Unclear offer.
- Irrelevant traffic source.
Do not assume the headline is the problem simply because it is easy to edit.
Low Traffic + Strong Results
These pages can represent opportunities.
If a small amount of relevant traffic produces meaningful engagement or conversions, consider whether additional appropriate traffic could be developed.
Low Traffic + Weak Results
These usually deserve less urgent attention unless the page is strategically important.
Not every page needs to become a major landing page.
Use UTM Parameters Carefully
If you promote the same page through newsletters, social campaigns, partnerships, or paid traffic, consistent campaign tagging can make acquisition analysis more useful.
But inconsistent UTM naming can create a reporting mess.
For a structured approach, see how to use UTM parameters in Google Analytics 4 without creating a reporting mess.
Do Not Judge a Landing Page by One Metric
The most common analytics mistake is looking for one number that declares a winner.
A page with the most sessions is not automatically the best page.
A page with the longest engagement time is not automatically the most profitable.
A page with the most key events may be benefiting from a particular traffic source rather than superior page design.
Useful analysis combines:
Entry traffic + engagement + business action + traffic source + page context
That gives you a much stronger basis for deciding what to improve.
Conclusion
The GA4 Landing page report helps answer one specific and valuable question:
Which pages are visitors using to enter my website?
Start by identifying the pages receiving meaningful entry sessions. Then compare active users, engagement, key events, relevant revenue data, and traffic sources.
Finally, inspect the actual page before making changes.
Do not optimize merely because one metric looks low.
Use analytics to locate opportunities, investigate the likely cause, make a focused improvement, and measure the result.
That turns the Landing page report from another screen of numbers into a practical website-improvement tool.