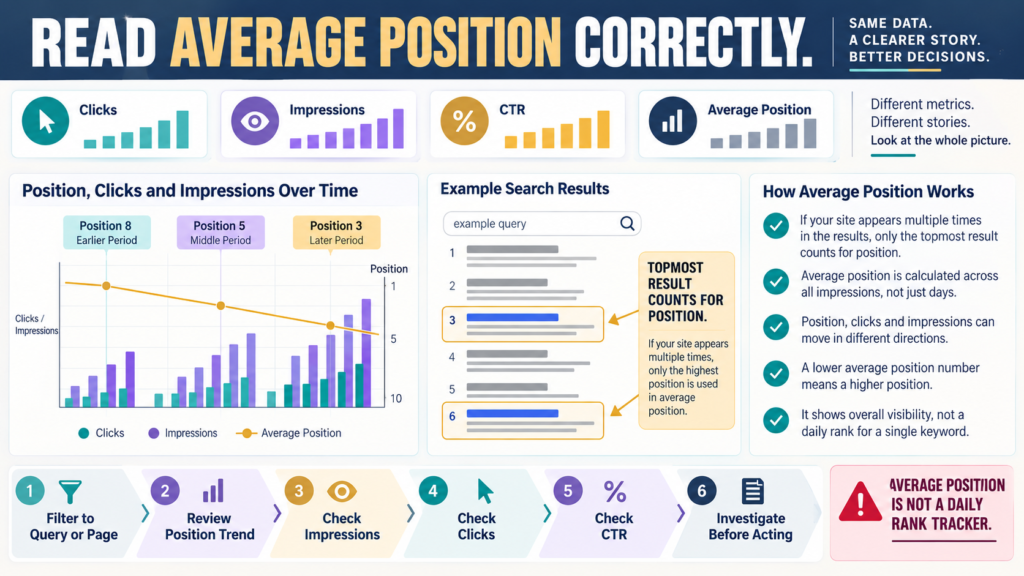
Google Search Console includes four familiar Performance metrics:
- Clicks.
- Impressions.
- CTR.
- Average position.
Average position may look like the simplest.
If the report says:
Position 5.2
you may naturally think:
“My page ranks around number five in Google.”
Sometimes that interpretation is directionally useful.
But Search Console’s position metric is more complicated.
Google currently defines average position as the average position of the topmost result from your property or selected page across the impressions where it appeared.
It is not a traditional fixed-rank tracker.
Start With the Word “Average”
Your site may appear:
- Position 2 for one search.
- Position 7 for another.
- Position 15 for another.
- Different positions in different locations.
- Different positions on different devices.
Search Console combines those observations.
That creates an average.
Your own manual search is only one search under one set of conditions.
Search Console Uses the Topmost Result
Suppose your property appears in one search at:
Position 2
Position 4
Position 7
Google says the property-level position is based on the topmost position, which would be 2 for that impression.
That matters when multiple pages or results from the same property appear.
Property and Page Aggregation Can Differ
Google documents different aggregation rules.
At the property level:
Results from the same property can be combined, with the topmost result used for position.
At the page level:
Individual URLs are evaluated separately.
Therefore, average position can change when you switch:
Property view
to:
Page-filtered view
even though you are looking at the same general site.
Average Position Requires an Impression
Google explains that a position is recorded when the search result receives an impression under Search Console’s rules.
If a result is never shown to the user under those conditions:
There is no recorded position for that impression.
This makes the metric fundamentally tied to visibility.
Position 1 Is Best
Search Console counts positions from the top.
So:
3 is generally better than 8
in the narrow ranking sense.
But do not automatically conclude that a falling numerical position means your traffic should increase.
You still need:
- Search demand.
- Impressions.
- CTR.
- Query intent.
Example: Better Position, Fewer Clicks
Last month:
Average Position: 8
Impressions: 10,000
Clicks: 500
This month:
Average Position: 5
Impressions: 3,000
Clicks: 250
Your average position improved.
Your clicks fell.
Possible explanation:
You appeared for fewer queries or lower-volume searches.
That is why position alone is incomplete.
Example: Worse Position, More Traffic
Last month:
Position: 4
Impressions: 1,000
Clicks: 100
This month:
Position: 7
Impressions: 10,000
Clicks: 400
Average position worsened.
Traffic increased substantially.
Perhaps the site began appearing for many additional searches at lower positions.
That can actually be a sign of expanding visibility.
Query Mix Changes the Average
Suppose your website ranks:
#2 for 10 brand searches
Then begins appearing:
#12 for 1,000 new non-branded searches
Your overall average position may worsen.
But your website gained much broader visibility.
Do not treat that as automatic SEO failure.
Use a Query Filter for More Precise Analysis
If you want to understand ranking movement for a particular search phrase:
- Open Performance.
- Filter to the query.
- Turn on Average position.
- Choose a meaningful date range.
- Compare periods.
Google specifically recommends filtering to a page or group of pages when tracking position history. It also advises focusing more on trends in clicks and impressions than position alone.
Use a Page Filter Too
Suppose several pages appear for the same query.
Filter to:
Query + Page
when you need a more focused view.
This avoids interpreting a property-level average as though one exact URL held that position every time.
Do Not Check Your Ranking Manually and Expect a Match
You search Google and see your page at position 8.
Search Console says:
Average Position 5.4
Which is correct?
Potentially both.
Google explains that your personal search can differ because of variables such as:
- Search history.
- Location.
- Search context.
Search Console reports an average across many actual impressions.
Search Result Features Complicate Position
Modern Google results contain:
- Standard links.
- Rich results.
- Carousels.
- Knowledge elements.
- Images.
- Other result types.
Google’s position documentation explains that search-result elements can occupy positions differently depending on their structure.
That is another reason not to interpret position as:
“The fifth blue link.”
Look for Trends Instead of Daily Numbers
Google recommends monitoring changes in position over time, especially meaningful or sudden changes.
That is much more useful than checking:
Monday: 6.2
Tuesday: 5.9
Wednesday: 6.4
Normal query and impression variation can move the average.
Use a longer view.
Weekly and Monthly Granularity Can Help
For longer-term analysis, Weekly and Monthly Search Console views can reduce the visual noise of daily fluctuations.
If average position has changed gradually for several months:
That deserves more attention than a one-day movement.
Combine Position With Impressions
Use this simple interpretation grid.
POSITION IMPROVES + IMPRESSIONS RISE
Potential positive visibility improvement.
POSITION IMPROVES + IMPRESSIONS FALL
Possibly narrower query coverage or lower demand.
POSITION WORSENS + IMPRESSIONS RISE
Could indicate broader discovery at lower positions.
POSITION WORSENS + IMPRESSIONS FALL
Worth deeper investigation.
None of these combinations proves the cause.
They tell you where to investigate.
Add Clicks and CTR
Next examine:
Clicks
and:
CTR
Suppose position remains steady but CTR falls.
Potential reasons include:
- Different query mix.
- Search-result layout changes.
- Competitor snippets.
- Title or description attractiveness.
- Branded vs non-branded traffic changes.
The Search Console branded vs non-branded query guide can help separate those types of searches.
Average Position Can Be Misleading at Site Level
Imagine a website with hundreds of pages.
One overall number combines:
- Brand queries.
- Tutorials.
- Product comparisons.
- Low-volume long-tail searches.
- High-volume searches.
That average may be too broad for a useful decision.
Filter to:
- One page.
- One query group.
- One content section.
before acting.
Do Not Chase Position Without Business Value
Suppose you improve from:
Position 8 to Position 3
for a query that produces:
- No relevant traffic.
- No leads.
- No customer value.
That may not matter much.
SEO should support useful traffic.
Not merely better-looking position numbers.
Watch for Search Console Data Issues
Google maintains a current data-anomalies page when known reporting issues affect Search Console metrics. In 2026, Google has documented several logging issues affecting various Performance-report metrics and search experiences.
If your chart suddenly behaves strangely:
Check whether Google has reported a known issue before rebuilding your website.
A Practical Average Position Workflow
Step 1
Choose one important page or query.
Step 2
Select:
Average Position + Impressions + Clicks + CTR
Step 3
Use at least several weeks of data.
Step 4
Compare equivalent periods.
Step 5
Determine whether query volume changed.
Step 6
Check page-level performance.
Step 7
Take action only after you understand the broader pattern.
A Simple Position Worksheet
Record:
Query/Page:
Current Position:
Previous Position:
Current Impressions:
Previous Impressions:
Current Clicks:
Previous Clicks:
Current CTR:
Previous CTR:
Likely Explanation:
Action Needed?:
This prevents position from becoming an isolated score.
Conclusion
Search Console average position is useful—but only when interpreted correctly.
It represents the average topmost position recorded across impressions for the selected property, page, query, or grouping.
It is not:
- A permanent ranking.
- A guaranteed manual-search position.
- A complete SEO score.
Use it alongside:
Impressions → Clicks → CTR → Query/Page Context
and focus more heavily on trends than one-day movements.
Your Next Action
Open:
Search Console → Performance → Search Results
Choose one important page.
Turn on:
Clicks | Impressions | CTR | Average Position
Compare:
Last 28 Days vs Previous 28 Days
Then write:
Position: Improved / Worsened / Stable
Impressions: Up / Down / Stable
Clicks: Up / Down / Stable
CTR: Up / Down / Stable
Do not make an SEO change until you can explain the relationship between all four metrics.
If position worsened but impressions increased strongly, investigate whether your page is appearing for more queries before assuming the page lost SEO strength.