A Google Search Console chart can make almost any traffic change look important.
A few strong days create a rising line.
A quiet weekend creates a dip.
A holiday changes search behavior.
One page gets unusual attention.
Then the website owner asks:
“Did my SEO improve or get worse?”
The Search Console Performance report has a built-in comparison feature designed to help answer questions like that.
Google currently allows comparisons between two time periods or two values within a dimension, and the results table displays a Difference column to help identify queries or pages that changed.
The important part is not merely clicking Compare.
It is choosing periods that can be compared fairly.
A practical workflow is:
Choose the question → select equivalent periods → keep filters consistent → compare clicks and impressions → inspect changed queries and pages → check context → investigate only meaningful patterns.
Start With the Question
Do not open Search Console and ask:
“What looks different?”
Start with a specific question.
Examples:
- Did organic search traffic decline this month?
- Did the updated article gain impressions?
- Did mobile CTR change?
- Did one section of the site lose visibility?
- Did search demand for a topic decline?
- Did a technical problem affect clicks?
The question determines the comparison.
Compare Equivalent Periods
Google’s comparison feature allows date comparisons such as:
- Last week vs previous week.
- This month vs previous month.
- Current period vs previous period.
- Custom date range vs another custom range.
Try to match the duration.
Weak comparison:
7 days vs 28 days
Better:
28 days vs previous 28 days
The totals then describe periods of equal length.
Watch the Day-of-Week Effect
Search behavior can change by weekday.
A Monday may behave differently from Saturday.
Google specifically recommends considering weekly or monthly time granularity when longer-term trend analysis would benefit from smoothing daily fluctuations such as weekends and holidays.
That means:
Monday–Sunday
compared with:
Monday–Sunday
is often more useful than periods that begin and end on different weekday patterns.
Use Weekly or Monthly Granularity for Longer Trends
Search Console now allows time granularity including hourly, daily, weekly, and monthly views where applicable.
Daily data is useful for:
- Outages.
- Sudden spikes.
- Specific incidents.
Weekly or monthly data can be better for:
- Long-term growth.
- Seasonal trends.
- Content performance.
- Broader SEO direction.
Do not use the most detailed view simply because it exists.
Make Sure Data Is Complete
Search Console’s newest Performance data can be preliminary.
Google indicates preliminary data using a dotted line, and the latest values may change as data collection finishes.
Be careful comparing:
complete previous period
with:
current period containing incomplete data.
That can create an artificial decline.
Remember the Time Zone
Standard Search Console date reporting uses Pacific Time.
Google says the 24-hour view uses the browser’s local time, but other date reporting uses Pacific Time.
This matters when you compare Search Console with:
- GA4.
- Sales data.
- Server logs.
- Email campaigns.
- Advertising.
A midnight boundary can place the same activity on different reporting dates.
Compare Clicks and Impressions Together
Suppose:
Clicks: down 15%
Impressions: down 16%
That may suggest overall search visibility or search demand declined.
Now suppose:
Clicks: down 15%
Impressions: unchanged
The question changes.
Possible areas to investigate include:
- CTR.
- Query mix.
- Search-result appearance.
- Rankings.
- User intent.
One metric rarely tells the entire story.
Do Not Start With Average Position
Average position is useful context.
It is not a perfect website ranking score.
Google explains that position metrics depend on how results are aggregated, and property-level versus page-level aggregation can produce different interpretations.
A website may start appearing for many new queries at lower positions.
Average position could decline while overall impressions increase.
That is not necessarily bad.
Focus first on:
- Clicks.
- Impressions.
- Relevant queries.
- Relevant pages.
Then use position as context.
Use the Difference Column
When two periods are compared, Search Console can show a Difference column.
Google’s guidance specifically recommends sorting by Difference to find queries or pages with significant change.
That is more useful than staring at the top ten queries.
A page that normally receives huge traffic may remain your top page even after declining.
The Difference column helps reveal what moved.
Start With Queries
Sort query differences.
Ask:
- Which queries gained clicks?
- Which lost clicks?
- Which gained impressions?
- Did branded search change?
- Did one topic decline?
- Did a new search phrase appear?
Then investigate the relevant pages.
For more complex query analysis, the existing guide to using regex in Google Search Console to find content opportunities can help group related search patterns.
Then Review Pages
A sitewide decline can sometimes be caused by one or two high-traffic URLs.
Compare pages.
Ask:
- Which page lost the most clicks?
- Which page lost impressions?
- Did one article gain enough to offset another?
- Were those pages changed?
- Is the page still indexed?
- Is search demand changing?
Do not rewrite the entire website because the sitewide chart declined.
Keep Filters Identical
If the first period is:
United States + Mobile + Web Search
and the second is:
All countries + All devices + Web Search
you are not making a useful comparison.
Keep:
- Search type.
- Country.
- Device.
- Query filters.
- Page filters.
consistent unless the comparison itself is specifically between those dimensions.
Google notes that you can compare dimensions such as country, device, page, or search appearance, but only one comparison can be active at a time.
Remember Privacy and Data Truncation
Search Console does not expose every individual query.
Google explains that some data is omitted for privacy, and query or URL filtering can change totals because of anonymized queries and data truncation.
That means adding all visible query rows may not equal the total shown in the chart.
Do not diagnose a tracking failure merely because the table does not sum perfectly.
Add Business Context
A change in search traffic can result from factors outside the website.
Examples:
- Seasonality.
- Holiday.
- News.
- Product launch.
- Email promotion.
- Search demand.
- Competitor activity.
- Site outage.
- Tracking anomaly.
Before editing content, write down what happened during each period.
Check Search Console Data Anomalies
Google maintains a public Search Console data-anomalies page documenting known reporting problems.
For example, Google currently lists August 2026 logging issues affecting certain Discover and Generative AI performance reporting periods.
This is important because a reporting anomaly is not the same as a real traffic loss.
Before assuming Google stopped showing the site, check whether the reporting system had a known issue.
Example Comparison
Suppose:
Last 28 Days
Clicks: 1,200
Impressions: 80,000
Previous 28 Days
Clicks: 1,350
Impressions: 81,000
Clicks declined about 11%.
Impressions declined only slightly.
Do not conclude:
“Google stopped indexing the website.”
Instead:
- Sort queries by click difference.
- Sort pages by click difference.
- Look at CTR.
- Check query mix.
- Check whether a high-volume page changed.
- Check whether the period includes unusual dates.
- Investigate the affected pages.
Example: Impressions Increase but Clicks Do Not
Suppose:
Impressions: +25%
Clicks: +2%
Possible explanations include:
- New lower-ranking queries.
- Different search intent.
- CTR change.
- Broader visibility without strong click demand.
That may actually be an early growth signal.
Investigate before judging it.
Example: Clicks and Impressions Both Collapse
This deserves faster attention.
Check:
- Website availability.
- Manual actions.
- Security.
- Indexing.
- Robots rules.
- Important page status.
- Recent redesign.
- Canonical changes.
- Search Console reporting anomalies.
Use a structured process such as diagnosing a drop in Google Search traffic before changing the website rather than immediately rewriting content.
Do Not Optimize From One Comparison
One 28-day comparison can identify a possible change.
It does not automatically establish a long-term trend.
Look at:
- Previous 3 months.
- Previous 6 months.
- Year-over-year when relevant.
- Weekly/monthly trend.
A decline may be part of normal seasonality.
An increase may be temporary.
Create a Short Comparison Note
After reviewing the data, record one paragraph:
Period compared:
Last 28 days vs previous 28 days.
Main change:
Clicks declined 11%; impressions remained nearly stable.
Primary cause:
Most lost clicks came from three queries associated with one article.
Next action:
Review search intent, page freshness, CTR, and competitors for that article.
Review again:
Four weeks.
This prevents you from forgetting why a website change was made.
Conclusion
Search Console’s comparison feature is most useful when the periods are genuinely comparable.
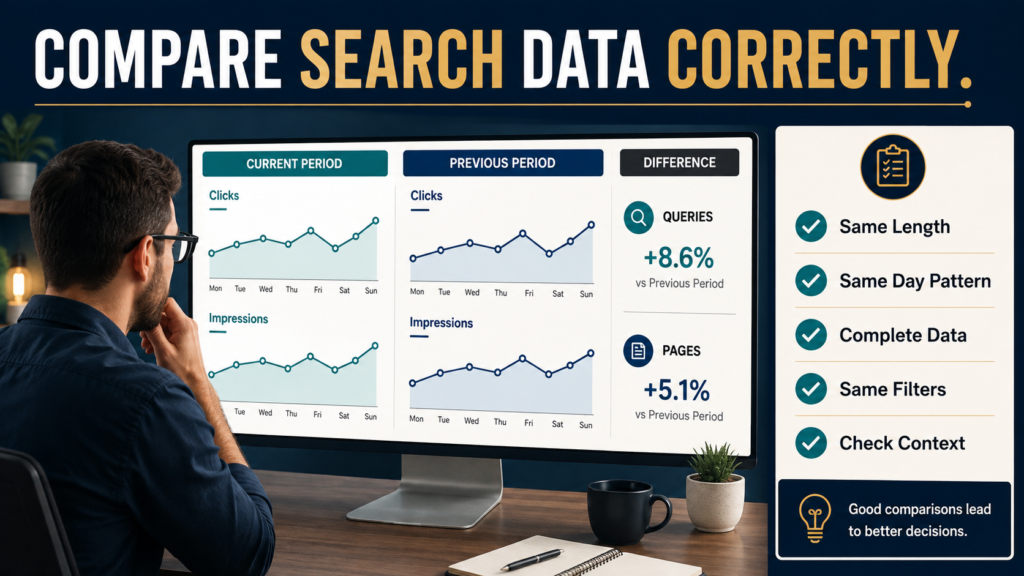
Match date-range length, account for day-of-week patterns, avoid incomplete preliminary data, keep filters consistent, compare clicks and impressions together, and use the Difference column to identify the queries and pages driving the change.
Then add context before changing the website.
The goal is not to explain every small fluctuation.
It is to distinguish normal variation from a meaningful pattern that deserves investigation.