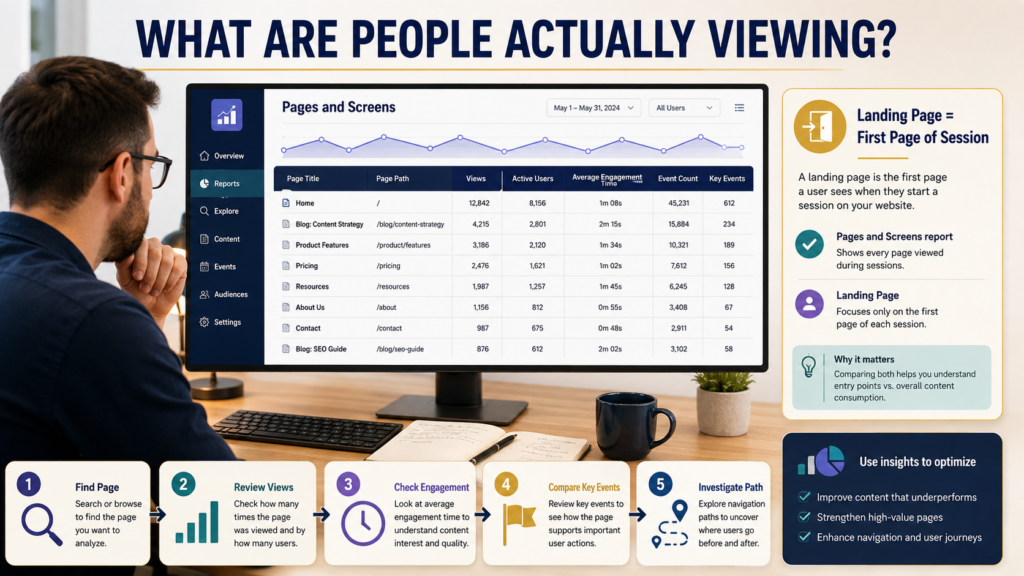
A visitor arrives at one of your blog posts.
Then the visitor opens your homepage.
Next, they read a product review.
Finally, they visit a resource page.
Those are four page views.
But only one page started the session.
This distinction explains why the GA4 Pages and Screens report and the Landing Page report can show different numbers and answer different questions.
Google defines Pages and Screens as a prebuilt report showing the pages users visited on a website and screens opened in an app. It includes pages viewed at any point during the user’s activity—not only the page that began the session.
The simplest mental model is:
Pages and Screens = What content did people view?
Landing Page = Where did a session begin?
Understanding that difference makes GA4 much easier to use.
What the Pages and Screens Report Is Designed to Show
Google’s current documentation lists dimensions such as:
- Page title.
- Page path.
- Hostname.
- Content group.
Metrics can include:
- Views.
- Active users.
- Views per active user.
- Average engagement time.
- Event count.
- Key events.
- Total revenue when applicable.
This makes the report especially useful for content analysis.
Start With Page Title or Page Path
Page title is easy to read.
Page path is often more precise.
Suppose several pages have titles that look similar.
A page path helps distinguish:
/blog//free-resources//product-review//thank-you/
Google says you can filter the report using Page path and screen class when you want to focus on one or several pages.
Views Are Not Sessions
This is one of the easiest GA4 mistakes to make.
If one visitor sees the same article three times during one session, those repeated views can contribute multiple views.
Do not interpret:
1,000 page views
as:
1,000 people
or:
1,000 sessions.
Different GA4 metrics describe different things.
Active Users Provide Another Perspective
Active users help answer:
How many distinct active users interacted with this content?
Now you can compare:
- Views.
- Active users.
- Views per active user.
If a resource page has high views per active user, there may be a perfectly good reason.
People may repeatedly return to a checklist, directory, tutorial, or tool.
Do not assume repeated views are automatically a problem.
Average Engagement Time Adds Context
Google defines average engagement time as the average time the site was in focus for users, based on engagement duration divided by active users.
Use it carefully.
Longer is not always better.
A page answering:
“What time does the event begin?”
may satisfy the visitor quickly.
A 3,000-word tutorial may reasonably require longer engagement.
Compare pages with similar purposes.
Event Count Tells You What Happened
A page view is itself an event in GA4, but visitors may trigger many other events.
Depending on your configuration, these might include:
- Scrolls.
- Clicks.
- Downloads.
- Video actions.
- Form submissions.
- Purchases.
- Other configured events.
Event count can help reveal whether a page is producing interaction beyond the initial view.
Key Events Connect Content to Business Actions
You can designate meaningful events as key events.
Examples could include:
- Lead-magnet signup.
- Purchase.
- Registration.
- Important form submission.
Do not mark everything as a key event.
The designation should represent something meaningful to your business.
Then ask:
Which pages are associated with useful actions?
That moves analysis beyond raw traffic.
Pages and Screens Is Not the Landing Page Report
Google explicitly notes that Pages and Screens includes pages viewed anywhere in the visit. To identify the first page someone landed on, Google directs users to the Landing Page report.
Consider:
Visitor path:
Article A → Article B → Review C
Pages and Screens sees all three.
Landing Page identifies Article A as the entry page for that session.
That is why the reports should not be expected to match.
Use the Right Report for the Question
Question: Which pages receive the most views?
Use Pages and Screens.
Question: Which pages start the most sessions?
Use Landing Page.
Question: Which content keeps users engaged?
Use Pages and Screens with engagement metrics.
Question: Which entry pages attract organic visitors?
Landing Page plus acquisition context may be more useful.
Question: Which pages are associated with key events?
Pages and Screens can help.
Analytics becomes much easier when the question comes before the report.
Connect This With Acquisition Data
Knowing a page is popular is only part of the story.
Ask:
Where did those visitors come from?
GA4’s acquisition reports help answer that.
But remember that User Acquisition and Traffic Acquisition use different scopes.
My GA4 User Acquisition vs Traffic Acquisition guide explains when each report is appropriate.
Compare Pages With Similar Jobs
Do not place every URL into one league table.
Group content.
Blog Articles
Compare:
- Views.
- Users.
- Engagement.
- Relevant key events.
- Internal navigation.
Product Reviews
Compare:
- Views.
- Engagement.
- Relevant outbound actions.
- Key events.
Lead-Magnet Pages
Compare:
- Views.
- Signup events.
- Conversion behavior.
Support Pages
High views may indicate usefulness—or recurring customer confusion.
Context matters.
Find High-View Pages With Weak Follow-Through
Suppose one article receives strong traffic but few visitors take the natural next step.
Investigate:
- Does the article satisfy the search intent?
- Is the next action relevant?
- Is the call to action visible?
- Is the internal link useful?
- Is the page attracting the wrong audience?
- Is measurement working correctly?
Do not immediately make the content more promotional.
First understand the mismatch.
Find Low-Traffic Pages With Strong Engagement
These can be overlooked opportunities.
A page receiving modest traffic but consistently producing:
- Strong engagement.
- Downloads.
- Signups.
- Product interest.
may deserve more internal linking or content support.
This is why my broader framework for measuring blog performance in GA4 without relying only on page views focuses on combining traffic with meaningful behavior.
Use Search Console for the Search Side
GA4 tells you about measured website behavior.
Search Console tells you more about Google Search visibility.
For a page receiving organic traffic, Search Console can add:
- Search queries.
- Impressions.
- Clicks.
- CTR.
- Average position.
GA4 can then add:
- Views.
- Users.
- Engagement.
- Events.
- Key events.
The two systems answer complementary questions.
Use Path Exploration for Before-and-After Behavior
Google’s documentation recommends Path Exploration when you want to understand what users did immediately before or after a particular page.
That is useful when asking:
What do people read after this article?
or:
Which pages tend to lead into this product review?
Pages and Screens tells you the page was viewed.
Path Exploration helps examine sequence.
Watch for Duplicate or Changing Page Titles
Page titles can create reporting confusion.
If multiple URLs share the same title, the Page title dimension may hide useful differences.
Switch to Page path when necessary.
Likewise, if a page title changes, reporting by title may appear fragmented across periods.
Use dimensions deliberately.
Consider Content Groups Later
Google Analytics supports content groups that categorize related pages into custom groups.
For example:
- Tutorials.
- Reviews.
- Lead magnets.
- Product pages.
This can be useful on a larger site.
But beginners should not add complex tracking simply because it exists.
Start with pages.
Add content grouping only when it solves a real reporting problem.
AI-Referral Traffic Can Be Viewed Through the Same Content Lens
If identifiable traffic arrives from AI assistants, you can ask:
Which pages are those visitors viewing?
My guide to tracking AI assistant traffic in Google Analytics 4 provides a starting point for separating identifiable AI-referral traffic.
Then Pages and Screens can help evaluate what content those visitors use.
A Simple Monthly Pages-and-Screens Review
Once per month:
- Open Pages and Screens.
- Review your most-viewed pages.
- Switch between page title and page path where useful.
- Review active users.
- Review engagement.
- Review relevant events.
- Review key events.
- Compare similar page types.
- Identify unusual increases or declines.
- Choose one to three pages worth investigating.
That is enough.
You do not need to optimize every page every month.
Common Mistakes
Mistake 1: Treating Views as People
They are different metrics.
Mistake 2: Treating Pages and Screens as Landing Pages
A page can be viewed without starting the session.
Mistake 3: Ranking Every Page by Engagement Time
Different content types have different goals.
Mistake 4: Looking Only at Traffic
Business actions matter too.
Mistake 5: Using Page Title When Page Path Is Needed
Choose the dimension that answers the question.
Mistake 6: Changing Pages Because One Week Looks Different
Use enough data to understand whether a real pattern exists.
Conclusion
The GA4 Pages and Screens report is one of the most useful places to understand what content people actually consume on your website.
Use page titles and paths to identify content, views to understand consumption, active users to add audience context, engagement to understand attention, and events or key events to connect pages with useful actions.
Most importantly, do not confuse a viewed page with a landing page.
Pages and Screens answers:
What did people view?
Landing Page answers:
Where did the session begin?
Once those questions are separated, both reports become far more useful.