A website can appear perfectly normal on your computer and still create problems for a large part of your audience.
Maybe:
- A form works on desktop but fails on mobile.
- A button behaves differently in Safari.
- A page layout breaks on a small screen.
- A checkout performs poorly on one operating system.
- Mobile users abandon a page much more often than desktop users.
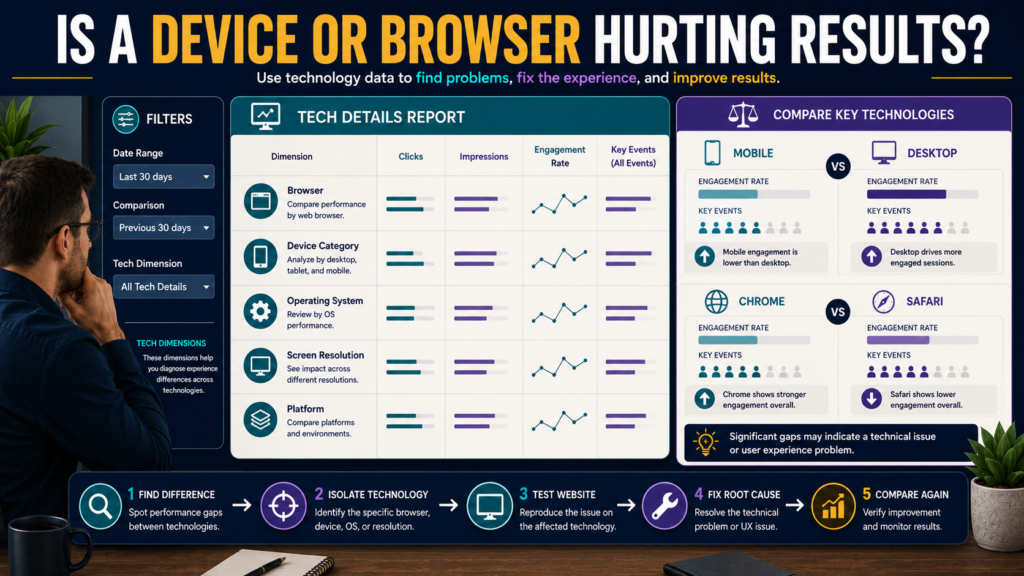
Google Analytics 4 includes a Tech Details report designed to show the technology people use when accessing your website or app.
Google’s current documentation says the report can include dimensions such as browser, screen resolution, operating system, platform, and other technology characteristics.
The report becomes especially useful when you ask:
Is a performance problem affecting everyone—or mainly people using one technology setup?
Where to Find the Report
Google’s current instructions place the default report under:
Reports → Tech → Tech details
An Editor or Administrator can add the report if it is not already available in the report navigation.
The exact report navigation can vary if the GA4 property has been customized.
Start With Device Category
A useful first dimension is:
- Desktop.
- Mobile.
- Tablet.
Suppose your website receives:
60% mobile traffic
but:
mobile key-event performance is much weaker than desktop.
That deserves investigation.
Do not conclude automatically that:
“Mobile users are bad customers.”
The website itself may be harder to use on smaller screens.
Compare Engagement, Not Just Users
A device category may bring many users but weak engagement.
Look at metrics such as:
- Active users.
- Sessions.
- Engagement.
- Relevant events.
- Key events.
The goal is to understand whether the technology segment is producing noticeably different behavior.
Example: Mobile Traffic Is High but Results Are Weak
Suppose:
Desktop
Strong engagement.
Healthy lead submissions.
Mobile
Similar traffic volume.
Much lower lead submissions.
Possible explanations include:
- Form is difficult to use.
- Button is below the fold.
- Popup covers content.
- Page loads slowly.
- Text is difficult to read.
- Navigation is confusing.
- Form fields behave badly.
Analytics identifies the segment.
It does not identify the root cause automatically.
You still need to test the website.
Switch to Browser
Browser comparison can reveal problems hidden by device category.
Examples:
- Chrome.
- Safari.
- Edge.
- Firefox.
- Other browsers.
Suppose Safari users show an unusual drop in completed forms.
Now you have a testable hypothesis:
Something may behave differently in Safari.
Open the page in Safari—or use appropriate browser-testing tools—and reproduce the process.
Do not change the website based solely on the report.
Browser Data Needs Enough Volume
If one browser has:
12 users
and another has:
5,000 users
do not compare percentages as though the samples are equally reliable.
Small groups can produce dramatic rates.
Look at actual counts.
Review Operating System
The Tech Details report can help analyze operating systems.
Depending on your audience, you may see:
- Windows.
- Macintosh.
- Android.
- iOS.
- Chrome OS.
- Others.
This can help isolate:
- Mobile platform differences.
- Browser/OS combinations.
- App-related behavior.
- Device-specific issues.
Again, the report tells you where a difference appears.
Testing tells you why.
Screen Resolution Can Reveal Layout Problems
Screen resolution can provide clues when a layout problem affects particular screen sizes.
Suppose one resolution group produces:
- Strong page traffic.
- Short engagement.
- Very low form completion.
Inspect the page at comparable dimensions.
Look for:
- Overlapping text.
- Off-screen buttons.
- Cut-off images.
- Horizontal scrolling.
- Popups that cannot close.
- Forms extending beyond the visible area.
Do not redesign around one obscure screen size with almost no users.
Prioritize meaningful audience groups.
Use Comparisons
GA4 supports comparisons and filters that can make the Tech Details report more useful.
For example:
Mobile vs Desktop
or:
Safari vs Chrome
Then ask:
- Are users different?
- Are engaged sessions different?
- Are key events different?
- Is revenue different where applicable?
Keep the date range and other context consistent.
Combine Tech Details With Landing Pages
Technology differences become more useful when connected with specific pages.
Suppose mobile performance is poor overall.
Which landing pages receive the mobile traffic?
If one old article is responsible for most of the problem, you may not have a sitewide issue.
The Landing Page report can identify where sessions begin.
Combine With Pages and Screens
If the problem involves a content page, use Pages and Screens.
Ask:
- Which pages are being viewed?
- Is engagement weak on the same pages?
- Are events firing?
- Are users navigating elsewhere?
This helps determine whether the technology issue is isolated.
Use Key Events Carefully
A useful test may involve:
Browser → lead key event
or:
Device category → purchase key event
But make sure your key events genuinely represent completed business actions.
Do not compare browsers using a meaningless “conversion” event.
The measurement plan should be correct first.
How This Fits With Broader GA4 Measurement
The verified guide to measuring blog performance in GA4 without relying only on page views is a good foundation because device analysis becomes much more useful when traffic is evaluated with engagement and meaningful actions.
Acquisition Can Explain Device Differences
Suppose mobile visitors behave differently.
Maybe the actual difference is traffic source.
For example:
Mobile visitors may come mostly from social media.
Desktop visitors may come mostly from Google Search.
Now:
device
and
acquisition channel
are mixed together.
Use acquisition reporting to check whether the audience source explains part of the difference.
The verified GA4 User Acquisition vs Traffic Acquisition guide explains the distinction between first-user and session-level acquisition.
Do Not Assume Technology Causes the Difference
Analytics shows correlation.
Suppose Safari users convert less.
That does not automatically prove Safari is causing the problem.
Safari users may differ in:
- Geography.
- Device.
- Traffic source.
- New vs returning status.
- Landing page.
- Product interest.
Use the report to create a hypothesis.
Then investigate.
A Practical Troubleshooting Workflow
Step 1 — Identify the Business Problem
Example:
Lead submissions declined.
Step 2 — Check Device Category
Is the decline concentrated?
Step 3 — Check Browser
Does one browser stand out?
Step 4 — Check Operating System
Is one OS responsible?
Step 5 — Check Relevant Pages
Which landing pages or forms are involved?
Step 6 — Test the Website
Reproduce the user experience.
Step 7 — Fix the Root Cause
Only after finding the actual problem.
Step 8 — Compare After the Fix
Did the affected segment improve?
Example: Form Problem
Imagine:
Chrome mobile: normal.
Safari mobile: very low form completion.
Testing shows the final submit button is hidden by a sticky footer in Safari.
Now you have a technical problem with evidence.
The solution is not:
“Rewrite the landing page.”
It is:
Fix the interface issue.
Example: Desktop Underperforms Mobile
Do not assume desktop should always perform better.
Maybe your audience finds you primarily through mobile search.
Maybe the offer is optimized for a mobile use case.
Maybe desktop traffic comes from low-intent referrals.
Investigate rather than imposing expectations.
Watch for Site Changes
If a technology problem appears suddenly, ask what changed.
Examples:
- New theme.
- New popup.
- New form plugin.
- Cookie banner.
- Analytics implementation.
- Checkout update.
- JavaScript.
- Video embed.
- Chat widget.
Record major website changes so later comparisons have context.
AI Assistant Traffic Can Be Analyzed by Technology Too
If you track identifiable AI-referral traffic, you may eventually want to understand which devices those visitors use.
The verified guide to tracking AI assistant traffic in Google Analytics 4 explains how identifiable referral traffic can be evaluated.
The Tech report then provides another segmentation layer.
Create a Simple Device Audit Table
| Segment | Users | Engagement | Key Event | Observation |
|---|---|---|---|---|
| Desktop | — | — | — | Baseline |
| Mobile | — | — | — | Review |
| Tablet | — | — | — | Low volume |
Then drill into browsers only when necessary.
Do not export 200 technology rows simply because GA4 provides them.
Common Mistakes
Mistake 1: Optimizing for Your Own Device
Your audience may use something different.
Mistake 2: Treating Every Percentage Difference as a Bug
Check sample size.
Mistake 3: Changing the Site Without Testing
Analytics gives clues, not proof.
Mistake 4: Ignoring Traffic Source
Device differences may reflect audience differences.
Mistake 5: Comparing Meaningless Key Events
Measurement definitions matter.
Mistake 6: Trying to Support Every Ancient Browser Equally
Prioritize meaningful audience segments.
Monthly Technology Check
For many small sites, once per month is enough.
Review:
- Device category.
- Top browsers.
- Major operating systems.
- Engagement.
- Important key events.
- Large unexplained differences.
- Recent website changes.
If nothing looks unusual, move on.
Conclusion
The GA4 Tech Details report helps answer a practical website question:
Are people using certain devices, browsers, operating systems, or screen configurations having a noticeably different experience?
Start with device category.
Drill into browser or operating system only when the evidence justifies it.
Compare engagement and meaningful actions.
Then test the website directly before making changes.
The report is not a device popularity contest.
Its value is helping you find technology-specific friction that would otherwise remain hidden inside sitewide averages.